Immigrants from Bolivia vs Tohono O'odham Disability Age 65 to 74
COMPARE
Immigrants from Bolivia
Tohono O'odham
Disability Age 65 to 74
Disability Age 65 to 74 Comparison
Immigrants from Bolivia
Tohono O'odham
20.8%
DISABILITY AGE 65 TO 74
99.9/ 100
METRIC RATING
21st/ 347
METRIC RANK
36.0%
DISABILITY AGE 65 TO 74
0.0/ 100
METRIC RATING
345th/ 347
METRIC RANK
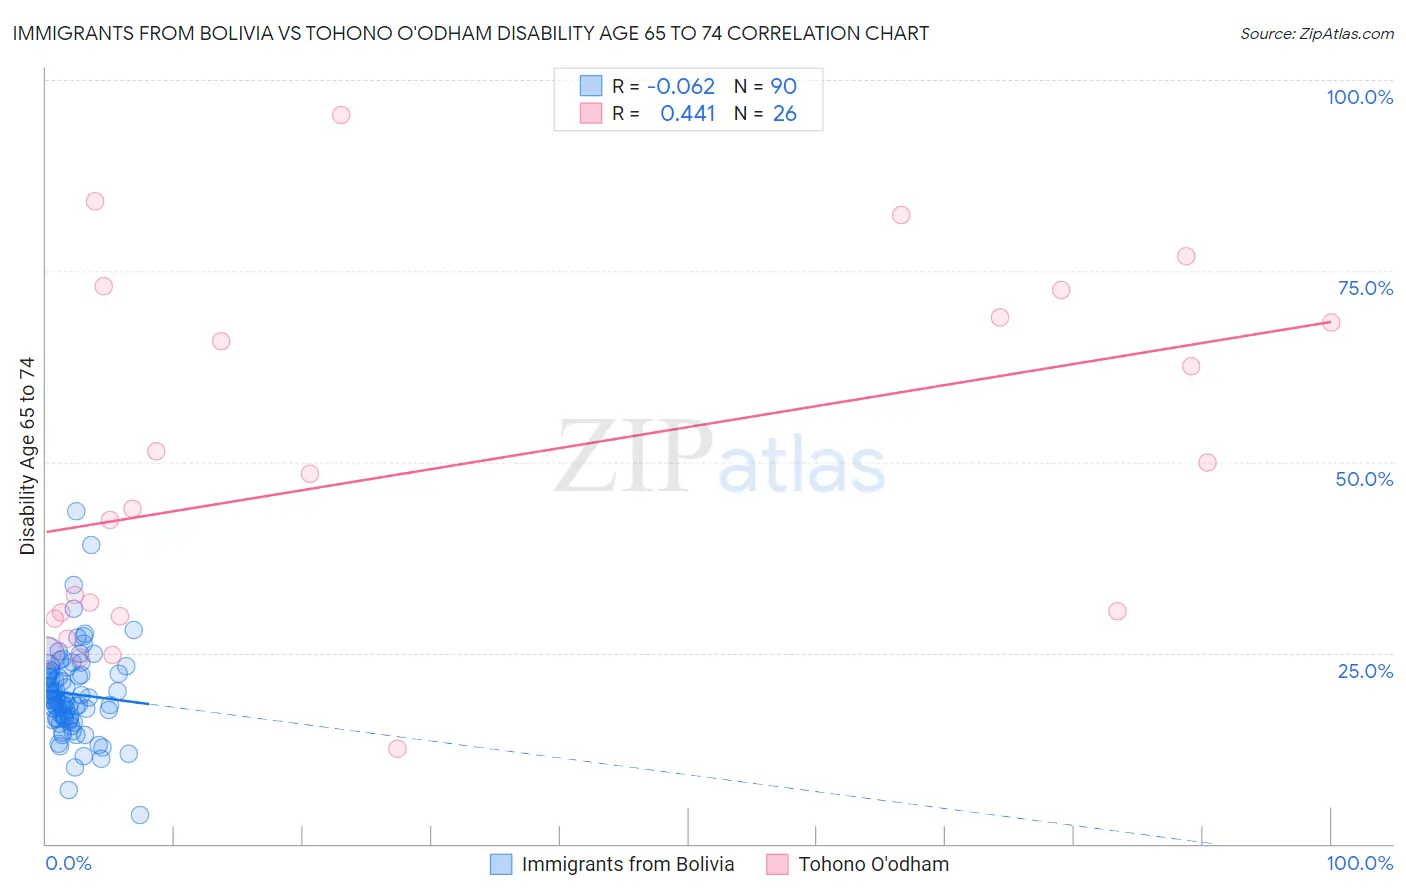
Immigrants from Bolivia vs Tohono O'odham Disability Age 65 to 74 Correlation Chart
The statistical analysis conducted on geographies consisting of 158,677,303 people shows a slight negative correlation between the proportion of Immigrants from Bolivia and percentage of population with a disability between the ages 65 and 75 in the United States with a correlation coefficient (R) of -0.062 and weighted average of 20.8%. Similarly, the statistical analysis conducted on geographies consisting of 58,691,657 people shows a moderate positive correlation between the proportion of Tohono O'odham and percentage of population with a disability between the ages 65 and 75 in the United States with a correlation coefficient (R) of 0.441 and weighted average of 36.0%, a difference of 72.9%.
Disability Age 65 to 74 Correlation Summary
| Measurement | Immigrants from Bolivia | Tohono O'odham |
| Minimum | 3.8% | 12.4% |
| Maximum | 43.5% | 95.5% |
| Range | 39.7% | 83.1% |
| Mean | 19.6% | 49.4% |
| Median | 18.9% | 46.1% |
| Interquartile 25% (IQ1) | 16.4% | 29.8% |
| Interquartile 75% (IQ3) | 22.2% | 69.0% |
| Interquartile Range (IQR) | 5.9% | 39.1% |
| Standard Deviation (Sample) | 5.9% | 23.1% |
| Standard Deviation (Population) | 5.8% | 22.6% |
Similar Demographics by Disability Age 65 to 74
Demographics Similar to Immigrants from Bolivia by Disability Age 65 to 74
In terms of disability age 65 to 74, the demographic groups most similar to Immigrants from Bolivia are Immigrants from Iran (20.9%, a difference of 0.23%), Immigrants from Belgium (21.0%, a difference of 0.53%), Soviet Union (21.0%, a difference of 0.58%), Bolivian (21.0%, a difference of 0.62%), and Immigrants from Australia (21.0%, a difference of 0.64%).
| Demographics | Rating | Rank | Disability Age 65 to 74 |
| Indians (Asian) | 100.0 /100 | #14 | Exceptional 20.5% |
| Paraguayans | 100.0 /100 | #15 | Exceptional 20.5% |
| Immigrants | Lithuania | 100.0 /100 | #16 | Exceptional 20.5% |
| Immigrants | South Central Asia | 100.0 /100 | #17 | Exceptional 20.6% |
| Eastern Europeans | 100.0 /100 | #18 | Exceptional 20.6% |
| Burmese | 100.0 /100 | #19 | Exceptional 20.6% |
| Okinawans | 100.0 /100 | #20 | Exceptional 20.7% |
| Immigrants | Bolivia | 99.9 /100 | #21 | Exceptional 20.8% |
| Immigrants | Iran | 99.9 /100 | #22 | Exceptional 20.9% |
| Immigrants | Belgium | 99.9 /100 | #23 | Exceptional 21.0% |
| Soviet Union | 99.9 /100 | #24 | Exceptional 21.0% |
| Bolivians | 99.9 /100 | #25 | Exceptional 21.0% |
| Immigrants | Australia | 99.9 /100 | #26 | Exceptional 21.0% |
| Immigrants | Sweden | 99.9 /100 | #27 | Exceptional 21.0% |
| Immigrants | Czechoslovakia | 99.9 /100 | #28 | Exceptional 21.0% |
Demographics Similar to Tohono O'odham by Disability Age 65 to 74
In terms of disability age 65 to 74, the demographic groups most similar to Tohono O'odham are Inupiat (34.5%, a difference of 4.3%), Yup'ik (37.8%, a difference of 5.0%), Pima (38.6%, a difference of 7.1%), Navajo (33.3%, a difference of 8.1%), and Pueblo (33.1%, a difference of 8.9%).
| Demographics | Rating | Rank | Disability Age 65 to 74 |
| Colville | 0.0 /100 | #333 | Tragic 30.5% |
| Alaska Natives | 0.0 /100 | #334 | Tragic 30.6% |
| Cheyenne | 0.0 /100 | #335 | Tragic 31.1% |
| Yuman | 0.0 /100 | #336 | Tragic 31.5% |
| Houma | 0.0 /100 | #337 | Tragic 32.3% |
| Alaskan Athabascans | 0.0 /100 | #338 | Tragic 32.4% |
| Kiowa | 0.0 /100 | #339 | Tragic 32.6% |
| Lumbee | 0.0 /100 | #340 | Tragic 32.7% |
| Tsimshian | 0.0 /100 | #341 | Tragic 32.9% |
| Pueblo | 0.0 /100 | #342 | Tragic 33.1% |
| Navajo | 0.0 /100 | #343 | Tragic 33.3% |
| Inupiat | 0.0 /100 | #344 | Tragic 34.5% |
| Tohono O'odham | 0.0 /100 | #345 | Tragic 36.0% |
| Yup'ik | 0.0 /100 | #346 | Tragic 37.8% |
| Pima | 0.0 /100 | #347 | Tragic 38.6% |