Immigrants from Belize vs Finnish Disability Age 65 to 74
COMPARE
Immigrants from Belize
Finnish
Disability Age 65 to 74
Disability Age 65 to 74 Comparison
Immigrants from Belize
Finns
25.8%
DISABILITY AGE 65 TO 74
0.1/ 100
METRIC RATING
278th/ 347
METRIC RANK
22.9%
DISABILITY AGE 65 TO 74
76.5/ 100
METRIC RATING
152nd/ 347
METRIC RANK
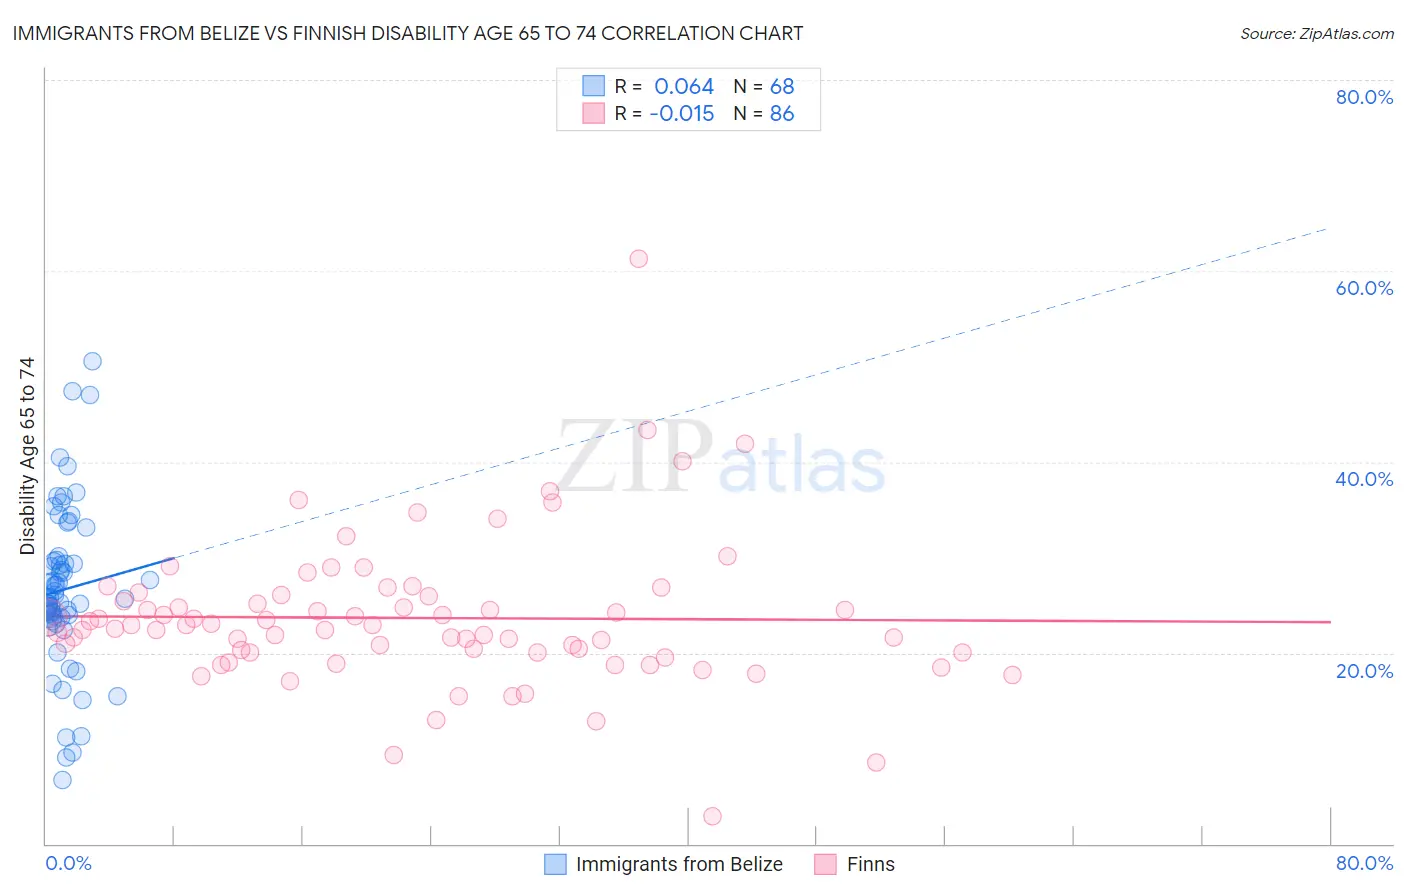
Immigrants from Belize vs Finnish Disability Age 65 to 74 Correlation Chart
The statistical analysis conducted on geographies consisting of 130,230,175 people shows a slight positive correlation between the proportion of Immigrants from Belize and percentage of population with a disability between the ages 65 and 75 in the United States with a correlation coefficient (R) of 0.064 and weighted average of 25.8%. Similarly, the statistical analysis conducted on geographies consisting of 404,031,913 people shows no correlation between the proportion of Finns and percentage of population with a disability between the ages 65 and 75 in the United States with a correlation coefficient (R) of -0.015 and weighted average of 22.9%, a difference of 12.7%.
Disability Age 65 to 74 Correlation Summary
| Measurement | Immigrants from Belize | Finnish |
| Minimum | 6.7% | 2.9% |
| Maximum | 50.6% | 61.3% |
| Range | 43.9% | 58.3% |
| Mean | 26.6% | 23.7% |
| Median | 25.8% | 22.7% |
| Interquartile 25% (IQ1) | 23.6% | 20.0% |
| Interquartile 75% (IQ3) | 29.7% | 25.9% |
| Interquartile Range (IQR) | 6.1% | 5.9% |
| Standard Deviation (Sample) | 8.5% | 7.8% |
| Standard Deviation (Population) | 8.4% | 7.8% |
Similar Demographics by Disability Age 65 to 74
Demographics Similar to Immigrants from Belize by Disability Age 65 to 74
In terms of disability age 65 to 74, the demographic groups most similar to Immigrants from Belize are Belizean (25.8%, a difference of 0.020%), U.S. Virgin Islander (25.9%, a difference of 0.080%), French American Indian (25.8%, a difference of 0.11%), American (25.8%, a difference of 0.13%), and Honduran (25.8%, a difference of 0.13%).
| Demographics | Rating | Rank | Disability Age 65 to 74 |
| Immigrants | Liberia | 0.1 /100 | #271 | Tragic 25.7% |
| Immigrants | Dominica | 0.1 /100 | #272 | Tragic 25.7% |
| Japanese | 0.1 /100 | #273 | Tragic 25.7% |
| Americans | 0.1 /100 | #274 | Tragic 25.8% |
| Hondurans | 0.1 /100 | #275 | Tragic 25.8% |
| French American Indians | 0.1 /100 | #276 | Tragic 25.8% |
| Belizeans | 0.1 /100 | #277 | Tragic 25.8% |
| Immigrants | Belize | 0.1 /100 | #278 | Tragic 25.8% |
| U.S. Virgin Islanders | 0.1 /100 | #279 | Tragic 25.9% |
| Cree | 0.1 /100 | #280 | Tragic 25.9% |
| Immigrants | Honduras | 0.1 /100 | #281 | Tragic 25.9% |
| Delaware | 0.1 /100 | #282 | Tragic 25.9% |
| Spanish Americans | 0.0 /100 | #283 | Tragic 25.9% |
| Immigrants | Azores | 0.0 /100 | #284 | Tragic 26.0% |
| Immigrants | Congo | 0.0 /100 | #285 | Tragic 26.0% |
Demographics Similar to Finns by Disability Age 65 to 74
In terms of disability age 65 to 74, the demographic groups most similar to Finns are Canadian (22.9%, a difference of 0.090%), Immigrants from Morocco (22.9%, a difference of 0.090%), Slavic (23.0%, a difference of 0.11%), Sri Lankan (23.0%, a difference of 0.20%), and British (23.0%, a difference of 0.21%).
| Demographics | Rating | Rank | Disability Age 65 to 74 |
| Immigrants | Uganda | 84.0 /100 | #145 | Excellent 22.8% |
| Alsatians | 83.7 /100 | #146 | Excellent 22.8% |
| Immigrants | Uzbekistan | 83.1 /100 | #147 | Excellent 22.8% |
| New Zealanders | 79.9 /100 | #148 | Good 22.9% |
| Swiss | 79.7 /100 | #149 | Good 22.9% |
| Canadians | 77.7 /100 | #150 | Good 22.9% |
| Immigrants | Morocco | 77.6 /100 | #151 | Good 22.9% |
| Finns | 76.5 /100 | #152 | Good 22.9% |
| Slavs | 75.2 /100 | #153 | Good 23.0% |
| Sri Lankans | 74.0 /100 | #154 | Good 23.0% |
| British | 73.9 /100 | #155 | Good 23.0% |
| Immigrants | Western Asia | 73.8 /100 | #156 | Good 23.0% |
| Czechoslovakians | 72.4 /100 | #157 | Good 23.0% |
| Immigrants | Vietnam | 69.1 /100 | #158 | Good 23.1% |
| South American Indians | 65.5 /100 | #159 | Good 23.1% |