Immigrants from Bahamas vs Immigrants from South Eastern Asia Vision Disability
COMPARE
Immigrants from Bahamas
Immigrants from South Eastern Asia
Vision Disability
Vision Disability Comparison
Immigrants from Bahamas
Immigrants from South Eastern Asia
2.4%
VISION DISABILITY
0.1/ 100
METRIC RATING
273rd/ 347
METRIC RANK
2.1%
VISION DISABILITY
86.3/ 100
METRIC RATING
137th/ 347
METRIC RANK
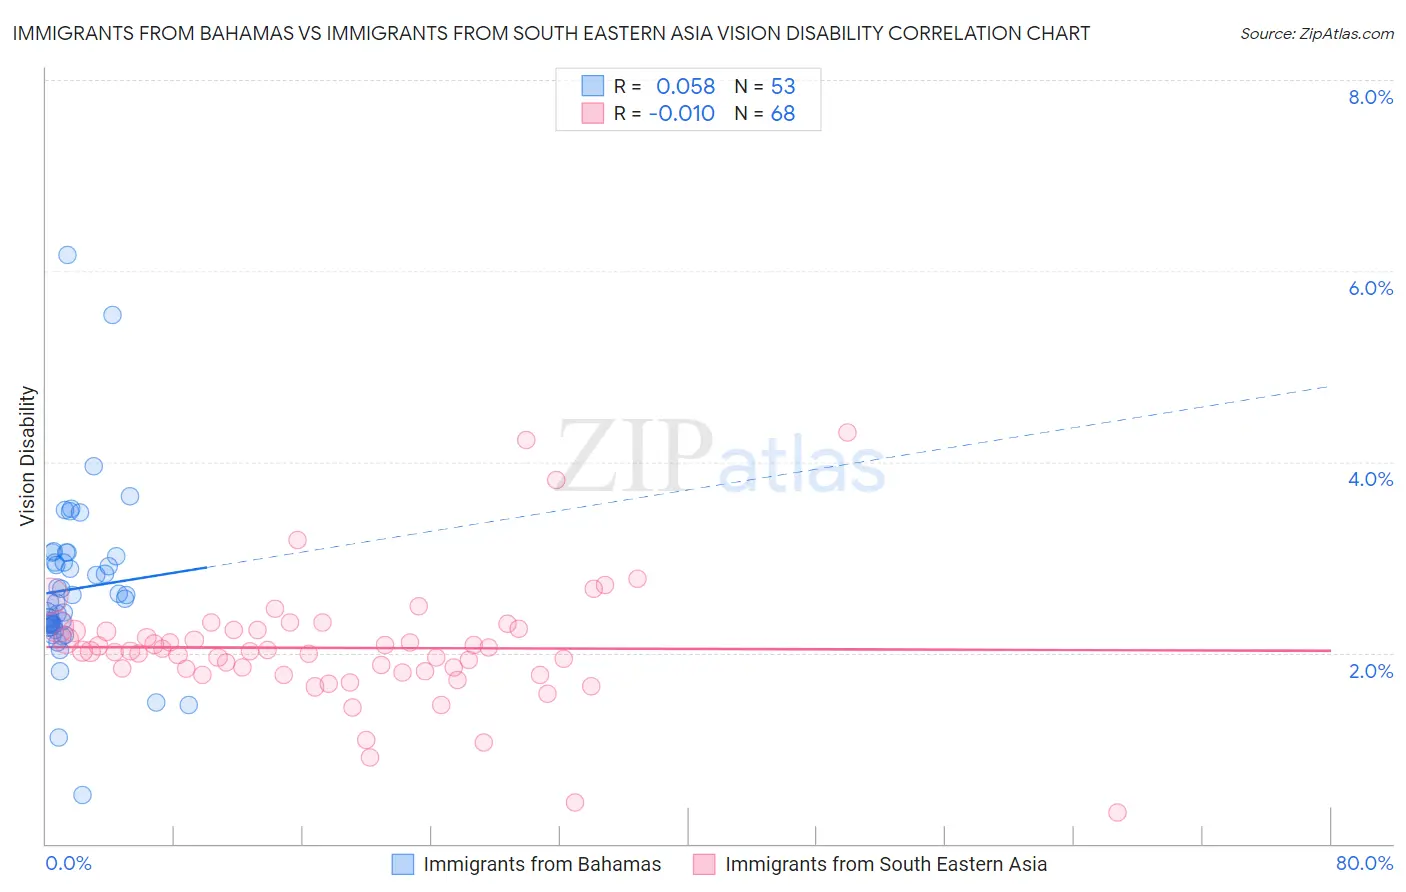
Immigrants from Bahamas vs Immigrants from South Eastern Asia Vision Disability Correlation Chart
The statistical analysis conducted on geographies consisting of 104,644,216 people shows a slight positive correlation between the proportion of Immigrants from Bahamas and percentage of population with vision disability in the United States with a correlation coefficient (R) of 0.058 and weighted average of 2.4%. Similarly, the statistical analysis conducted on geographies consisting of 511,864,727 people shows no correlation between the proportion of Immigrants from South Eastern Asia and percentage of population with vision disability in the United States with a correlation coefficient (R) of -0.010 and weighted average of 2.1%, a difference of 15.2%.
Vision Disability Correlation Summary
| Measurement | Immigrants from Bahamas | Immigrants from South Eastern Asia |
| Minimum | 0.51% | 0.33% |
| Maximum | 6.2% | 4.3% |
| Range | 5.7% | 4.0% |
| Mean | 2.7% | 2.1% |
| Median | 2.5% | 2.0% |
| Interquartile 25% (IQ1) | 2.3% | 1.8% |
| Interquartile 75% (IQ3) | 3.0% | 2.2% |
| Interquartile Range (IQR) | 0.70% | 0.44% |
| Standard Deviation (Sample) | 0.89% | 0.65% |
| Standard Deviation (Population) | 0.88% | 0.64% |
Similar Demographics by Vision Disability
Demographics Similar to Immigrants from Bahamas by Vision Disability
In terms of vision disability, the demographic groups most similar to Immigrants from Bahamas are Immigrants from Latin America (2.4%, a difference of 0.31%), Spaniard (2.4%, a difference of 0.33%), Immigrants from the Azores (2.4%, a difference of 0.43%), Cuban (2.4%, a difference of 0.59%), and Celtic (2.4%, a difference of 0.60%).
| Demographics | Rating | Rank | Vision Disability |
| Mexican American Indians | 0.1 /100 | #266 | Tragic 2.4% |
| Ute | 0.1 /100 | #267 | Tragic 2.4% |
| Senegalese | 0.1 /100 | #268 | Tragic 2.4% |
| Celtics | 0.1 /100 | #269 | Tragic 2.4% |
| Cubans | 0.1 /100 | #270 | Tragic 2.4% |
| Immigrants | Azores | 0.1 /100 | #271 | Tragic 2.4% |
| Spaniards | 0.1 /100 | #272 | Tragic 2.4% |
| Immigrants | Bahamas | 0.1 /100 | #273 | Tragic 2.4% |
| Immigrants | Latin America | 0.0 /100 | #274 | Tragic 2.4% |
| Chippewa | 0.0 /100 | #275 | Tragic 2.4% |
| Scotch-Irish | 0.0 /100 | #276 | Tragic 2.4% |
| Bahamians | 0.0 /100 | #277 | Tragic 2.4% |
| Spanish | 0.0 /100 | #278 | Tragic 2.4% |
| Nepalese | 0.0 /100 | #279 | Tragic 2.4% |
| Cape Verdeans | 0.0 /100 | #280 | Tragic 2.4% |
Demographics Similar to Immigrants from South Eastern Asia by Vision Disability
In terms of vision disability, the demographic groups most similar to Immigrants from South Eastern Asia are Czech (2.1%, a difference of 0.0%), Arab (2.1%, a difference of 0.010%), Vietnamese (2.1%, a difference of 0.050%), Venezuelan (2.1%, a difference of 0.12%), and Immigrants from Morocco (2.1%, a difference of 0.15%).
| Demographics | Rating | Rank | Vision Disability |
| Immigrants | Kenya | 88.7 /100 | #130 | Excellent 2.1% |
| Immigrants | Hungary | 88.7 /100 | #131 | Excellent 2.1% |
| New Zealanders | 88.2 /100 | #132 | Excellent 2.1% |
| Syrians | 87.5 /100 | #133 | Excellent 2.1% |
| Venezuelans | 87.2 /100 | #134 | Excellent 2.1% |
| Vietnamese | 86.7 /100 | #135 | Excellent 2.1% |
| Czechs | 86.3 /100 | #136 | Excellent 2.1% |
| Immigrants | South Eastern Asia | 86.3 /100 | #137 | Excellent 2.1% |
| Arabs | 86.3 /100 | #138 | Excellent 2.1% |
| Immigrants | Morocco | 85.2 /100 | #139 | Excellent 2.1% |
| Immigrants | Netherlands | 84.2 /100 | #140 | Excellent 2.1% |
| Sierra Leoneans | 84.1 /100 | #141 | Excellent 2.1% |
| South Americans | 82.8 /100 | #142 | Excellent 2.1% |
| Immigrants | Sierra Leone | 82.8 /100 | #143 | Excellent 2.1% |
| Ukrainians | 81.9 /100 | #144 | Excellent 2.1% |