Immigrants from Bahamas vs Bulgarian Disability Age 35 to 64
COMPARE
Immigrants from Bahamas
Bulgarian
Disability Age 35 to 64
Disability Age 35 to 64 Comparison
Immigrants from Bahamas
Bulgarians
11.8%
DISABILITY AGE 35 TO 64
9.2/ 100
METRIC RATING
218th/ 347
METRIC RANK
9.7%
DISABILITY AGE 35 TO 64
99.9/ 100
METRIC RATING
35th/ 347
METRIC RANK
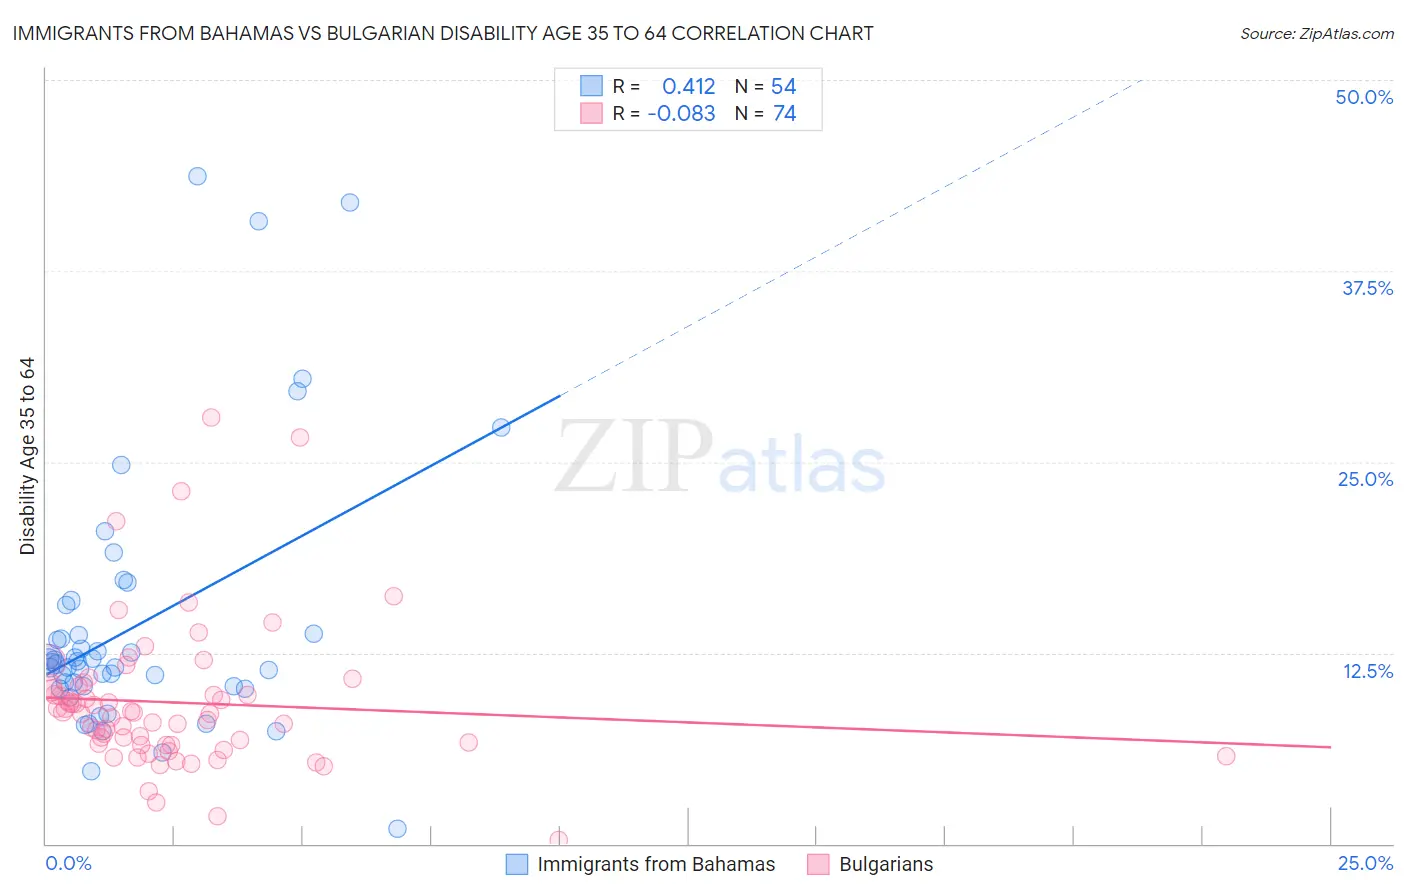
Immigrants from Bahamas vs Bulgarian Disability Age 35 to 64 Correlation Chart
The statistical analysis conducted on geographies consisting of 104,614,213 people shows a moderate positive correlation between the proportion of Immigrants from Bahamas and percentage of population with a disability between the ages 34 and 64 in the United States with a correlation coefficient (R) of 0.412 and weighted average of 11.8%. Similarly, the statistical analysis conducted on geographies consisting of 205,563,326 people shows a slight negative correlation between the proportion of Bulgarians and percentage of population with a disability between the ages 34 and 64 in the United States with a correlation coefficient (R) of -0.083 and weighted average of 9.7%, a difference of 21.8%.
Disability Age 35 to 64 Correlation Summary
| Measurement | Immigrants from Bahamas | Bulgarian |
| Minimum | 0.98% | 0.21% |
| Maximum | 43.7% | 27.9% |
| Range | 42.7% | 27.7% |
| Mean | 14.3% | 9.2% |
| Median | 11.8% | 8.6% |
| Interquartile 25% (IQ1) | 10.3% | 6.5% |
| Interquartile 75% (IQ3) | 13.8% | 10.3% |
| Interquartile Range (IQR) | 3.4% | 3.8% |
| Standard Deviation (Sample) | 8.8% | 4.8% |
| Standard Deviation (Population) | 8.7% | 4.8% |
Similar Demographics by Disability Age 35 to 64
Demographics Similar to Immigrants from Bahamas by Disability Age 35 to 64
In terms of disability age 35 to 64, the demographic groups most similar to Immigrants from Bahamas are Czechoslovakian (11.8%, a difference of 0.040%), Barbadian (11.8%, a difference of 0.050%), Immigrants from West Indies (11.8%, a difference of 0.090%), Alsatian (11.8%, a difference of 0.18%), and Honduran (11.8%, a difference of 0.19%).
| Demographics | Rating | Rank | Disability Age 35 to 64 |
| Canadians | 13.0 /100 | #211 | Poor 11.7% |
| Immigrants | Jamaica | 11.8 /100 | #212 | Poor 11.7% |
| Yugoslavians | 11.6 /100 | #213 | Poor 11.7% |
| Immigrants | Sudan | 11.4 /100 | #214 | Poor 11.7% |
| Spanish American Indians | 11.1 /100 | #215 | Poor 11.7% |
| Bahamians | 10.7 /100 | #216 | Poor 11.8% |
| Barbadians | 9.5 /100 | #217 | Tragic 11.8% |
| Immigrants | Bahamas | 9.2 /100 | #218 | Tragic 11.8% |
| Czechoslovakians | 9.0 /100 | #219 | Tragic 11.8% |
| Immigrants | West Indies | 8.9 /100 | #220 | Tragic 11.8% |
| Alsatians | 8.5 /100 | #221 | Tragic 11.8% |
| Hondurans | 8.4 /100 | #222 | Tragic 11.8% |
| Immigrants | Honduras | 8.4 /100 | #223 | Tragic 11.8% |
| Immigrants | Ghana | 7.8 /100 | #224 | Tragic 11.8% |
| Immigrants | Belize | 6.6 /100 | #225 | Tragic 11.9% |
Demographics Similar to Bulgarians by Disability Age 35 to 64
In terms of disability age 35 to 64, the demographic groups most similar to Bulgarians are Immigrants from Cuba (9.7%, a difference of 0.040%), Immigrants from Australia (9.7%, a difference of 0.10%), Immigrants from Turkey (9.7%, a difference of 0.11%), Immigrants from Indonesia (9.7%, a difference of 0.17%), and Egyptian (9.7%, a difference of 0.18%).
| Demographics | Rating | Rank | Disability Age 35 to 64 |
| Immigrants | Pakistan | 100.0 /100 | #28 | Exceptional 9.5% |
| Immigrants | Ireland | 100.0 /100 | #29 | Exceptional 9.5% |
| Immigrants | Japan | 100.0 /100 | #30 | Exceptional 9.5% |
| Immigrants | Lithuania | 99.9 /100 | #31 | Exceptional 9.6% |
| Turks | 99.9 /100 | #32 | Exceptional 9.7% |
| Immigrants | Indonesia | 99.9 /100 | #33 | Exceptional 9.7% |
| Immigrants | Australia | 99.9 /100 | #34 | Exceptional 9.7% |
| Bulgarians | 99.9 /100 | #35 | Exceptional 9.7% |
| Immigrants | Cuba | 99.9 /100 | #36 | Exceptional 9.7% |
| Immigrants | Turkey | 99.9 /100 | #37 | Exceptional 9.7% |
| Egyptians | 99.9 /100 | #38 | Exceptional 9.7% |
| Immigrants | Belarus | 99.9 /100 | #39 | Exceptional 9.7% |
| Immigrants | Armenia | 99.9 /100 | #40 | Exceptional 9.7% |
| Israelis | 99.9 /100 | #41 | Exceptional 9.7% |
| Immigrants | Malaysia | 99.9 /100 | #42 | Exceptional 9.7% |