Immigrants from the Azores vs Immigrants from Congo Disability Age 35 to 64
COMPARE
Immigrants from the Azores
Immigrants from Congo
Disability Age 35 to 64
Disability Age 35 to 64 Comparison
Immigrants from the Azores
Immigrants from Congo
14.3%
DISABILITY AGE 35 TO 64
0.0/ 100
METRIC RATING
311th/ 347
METRIC RANK
13.3%
DISABILITY AGE 35 TO 64
0.0/ 100
METRIC RATING
291st/ 347
METRIC RANK
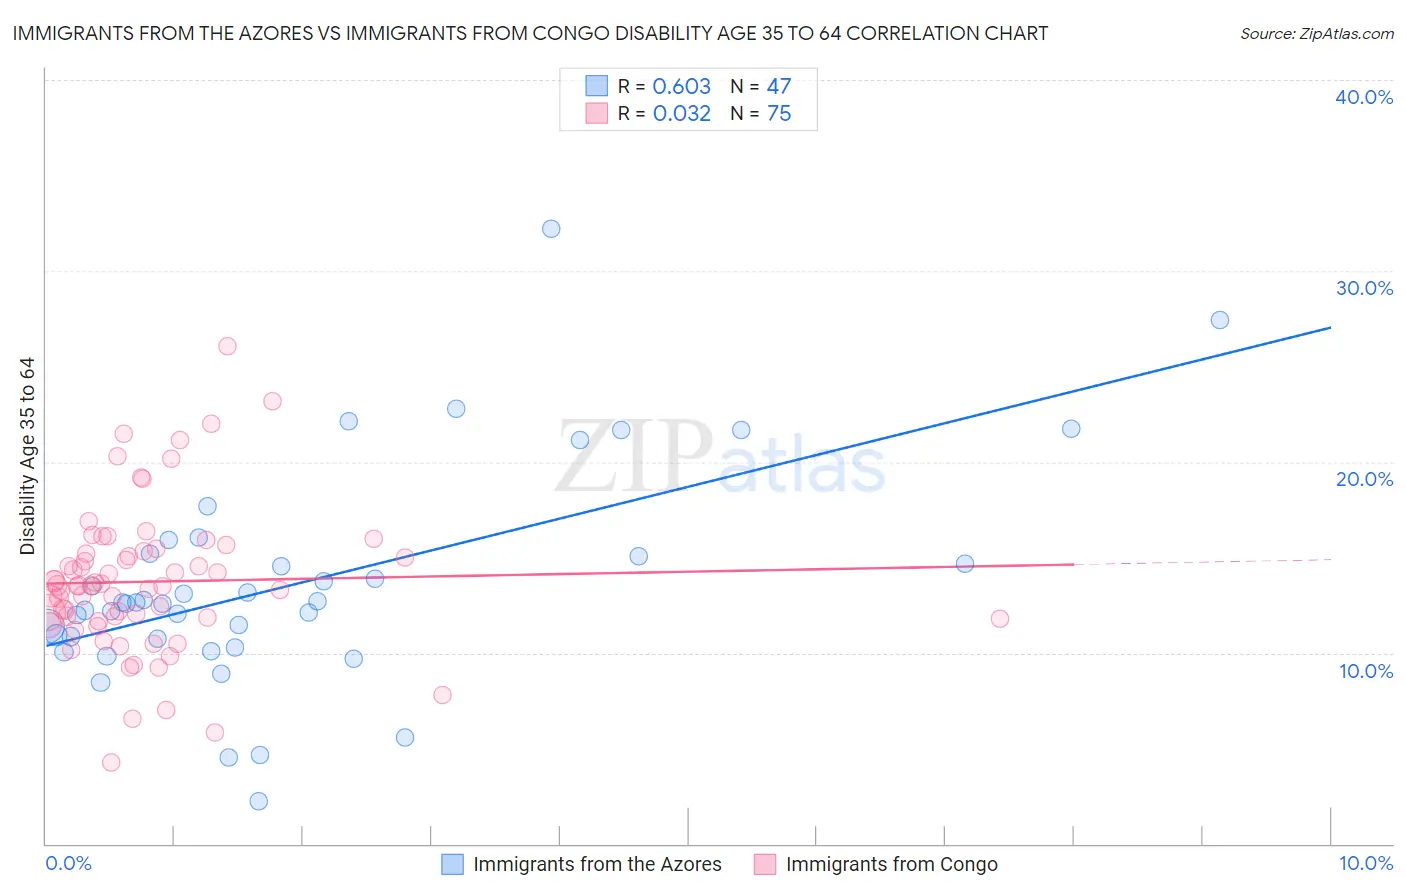
Immigrants from the Azores vs Immigrants from Congo Disability Age 35 to 64 Correlation Chart
The statistical analysis conducted on geographies consisting of 46,256,915 people shows a significant positive correlation between the proportion of Immigrants from the Azores and percentage of population with a disability between the ages 34 and 64 in the United States with a correlation coefficient (R) of 0.603 and weighted average of 14.3%. Similarly, the statistical analysis conducted on geographies consisting of 92,070,909 people shows no correlation between the proportion of Immigrants from Congo and percentage of population with a disability between the ages 34 and 64 in the United States with a correlation coefficient (R) of 0.032 and weighted average of 13.3%, a difference of 7.2%.
Disability Age 35 to 64 Correlation Summary
| Measurement | Immigrants from the Azores | Immigrants from Congo |
| Minimum | 2.2% | 4.3% |
| Maximum | 32.2% | 26.1% |
| Range | 30.0% | 21.8% |
| Mean | 13.7% | 13.7% |
| Median | 12.6% | 13.5% |
| Interquartile 25% (IQ1) | 10.7% | 11.8% |
| Interquartile 75% (IQ3) | 15.2% | 15.3% |
| Interquartile Range (IQR) | 4.5% | 3.5% |
| Standard Deviation (Sample) | 5.7% | 3.9% |
| Standard Deviation (Population) | 5.7% | 3.8% |
Demographics Similar to Immigrants from the Azores and Immigrants from Congo by Disability Age 35 to 64
In terms of disability age 35 to 64, the demographic groups most similar to Immigrants from the Azores are Cape Verdean (14.1%, a difference of 0.92%), Cree (14.1%, a difference of 1.4%), Inupiat (14.1%, a difference of 1.5%), Blackfeet (14.1%, a difference of 1.5%), and Immigrants from Yemen (14.0%, a difference of 1.7%). Similarly, the demographic groups most similar to Immigrants from Congo are Puget Sound Salish (13.3%, a difference of 0.050%), Ute (13.4%, a difference of 0.52%), Yaqui (13.5%, a difference of 1.1%), Yakama (13.6%, a difference of 1.8%), and African (13.6%, a difference of 2.0%).
| Demographics | Rating | Rank | Disability Age 35 to 64 |
| Immigrants | Congo | 0.0 /100 | #291 | Tragic 13.3% |
| Puget Sound Salish | 0.0 /100 | #292 | Tragic 13.3% |
| Ute | 0.0 /100 | #293 | Tragic 13.4% |
| Yaqui | 0.0 /100 | #294 | Tragic 13.5% |
| Yakama | 0.0 /100 | #295 | Tragic 13.6% |
| Africans | 0.0 /100 | #296 | Tragic 13.6% |
| Bangladeshis | 0.0 /100 | #297 | Tragic 13.6% |
| Cheyenne | 0.0 /100 | #298 | Tragic 13.6% |
| Spanish Americans | 0.0 /100 | #299 | Tragic 13.7% |
| Delaware | 0.0 /100 | #300 | Tragic 13.7% |
| French American Indians | 0.0 /100 | #301 | Tragic 13.7% |
| Aleuts | 0.0 /100 | #302 | Tragic 13.8% |
| Sioux | 0.0 /100 | #303 | Tragic 13.9% |
| Hopi | 0.0 /100 | #304 | Tragic 13.9% |
| Americans | 0.0 /100 | #305 | Tragic 13.9% |
| Immigrants | Yemen | 0.0 /100 | #306 | Tragic 14.0% |
| Blackfeet | 0.0 /100 | #307 | Tragic 14.1% |
| Inupiat | 0.0 /100 | #308 | Tragic 14.1% |
| Cree | 0.0 /100 | #309 | Tragic 14.1% |
| Cape Verdeans | 0.0 /100 | #310 | Tragic 14.1% |
| Immigrants | Azores | 0.0 /100 | #311 | Tragic 14.3% |