Immigrants from the Azores vs Hungarian Ambulatory Disability
COMPARE
Immigrants from the Azores
Hungarian
Ambulatory Disability
Ambulatory Disability Comparison
Immigrants from the Azores
Hungarians
7.1%
AMBULATORY DISABILITY
0.0/ 100
METRIC RATING
309th/ 347
METRIC RANK
6.3%
AMBULATORY DISABILITY
9.6/ 100
METRIC RATING
221st/ 347
METRIC RANK
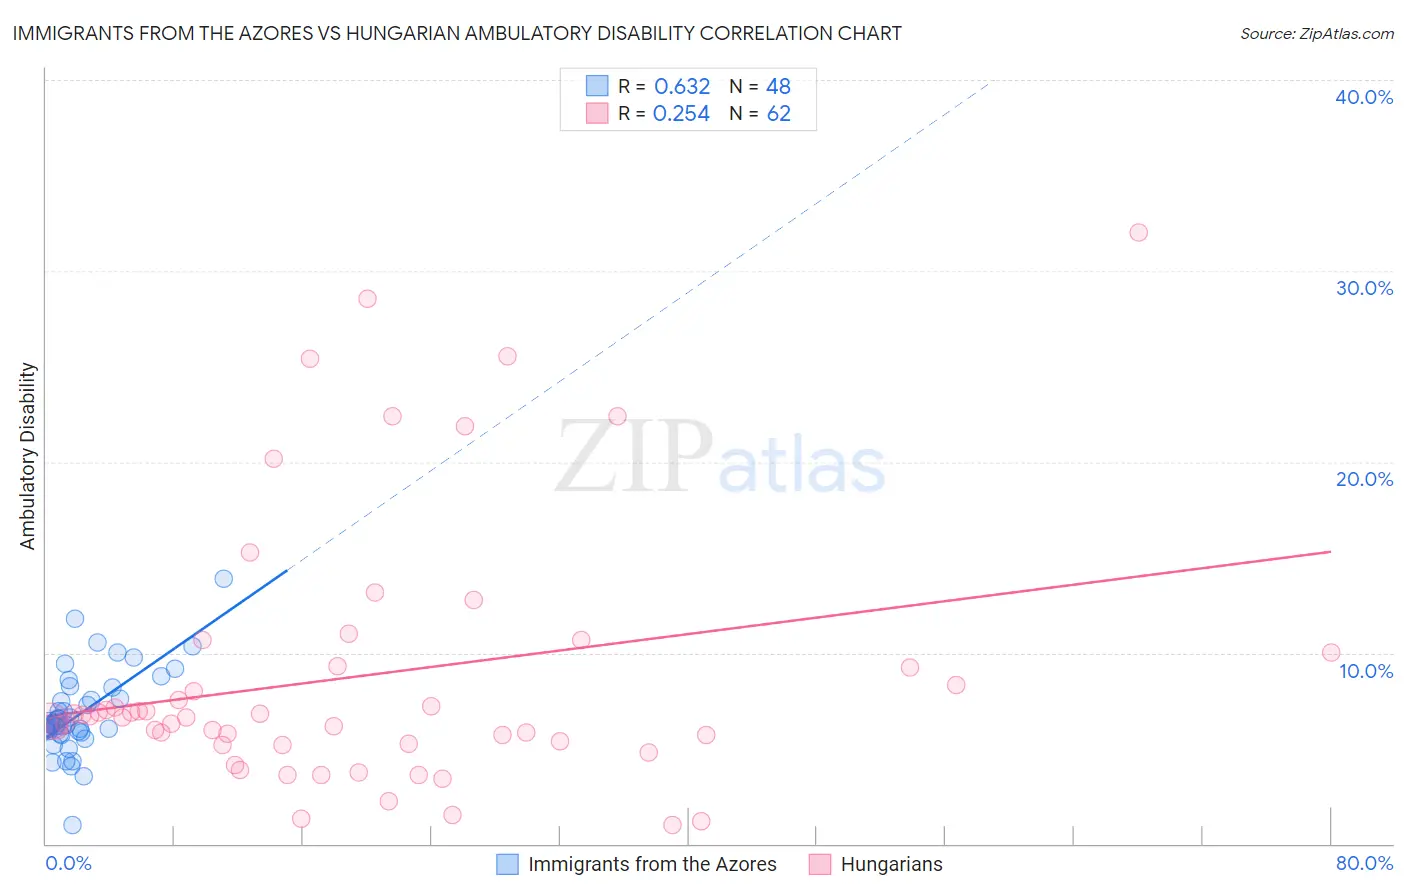
Immigrants from the Azores vs Hungarian Ambulatory Disability Correlation Chart
The statistical analysis conducted on geographies consisting of 46,257,178 people shows a significant positive correlation between the proportion of Immigrants from the Azores and percentage of population with ambulatory disability in the United States with a correlation coefficient (R) of 0.632 and weighted average of 7.1%. Similarly, the statistical analysis conducted on geographies consisting of 486,018,761 people shows a weak positive correlation between the proportion of Hungarians and percentage of population with ambulatory disability in the United States with a correlation coefficient (R) of 0.254 and weighted average of 6.3%, a difference of 12.4%.
Ambulatory Disability Correlation Summary
| Measurement | Immigrants from the Azores | Hungarian |
| Minimum | 0.99% | 1.0% |
| Maximum | 13.9% | 32.0% |
| Range | 12.9% | 31.0% |
| Mean | 6.8% | 8.8% |
| Median | 6.2% | 6.7% |
| Interquartile 25% (IQ1) | 5.9% | 5.2% |
| Interquartile 75% (IQ3) | 7.9% | 9.3% |
| Interquartile Range (IQR) | 2.0% | 4.1% |
| Standard Deviation (Sample) | 2.2% | 6.9% |
| Standard Deviation (Population) | 2.2% | 6.8% |
Similar Demographics by Ambulatory Disability
Demographics Similar to Immigrants from the Azores by Ambulatory Disability
In terms of ambulatory disability, the demographic groups most similar to Immigrants from the Azores are Spanish American (7.1%, a difference of 0.17%), Chippewa (7.1%, a difference of 0.17%), Arapaho (7.1%, a difference of 0.28%), Cree (7.1%, a difference of 0.29%), and Iroquois (7.1%, a difference of 0.44%).
| Demographics | Rating | Rank | Ambulatory Disability |
| Immigrants | Armenia | 0.0 /100 | #302 | Tragic 7.0% |
| Africans | 0.0 /100 | #303 | Tragic 7.0% |
| Immigrants | Cabo Verde | 0.0 /100 | #304 | Tragic 7.0% |
| Immigrants | Micronesia | 0.0 /100 | #305 | Tragic 7.0% |
| Iroquois | 0.0 /100 | #306 | Tragic 7.1% |
| Spanish Americans | 0.0 /100 | #307 | Tragic 7.1% |
| Chippewa | 0.0 /100 | #308 | Tragic 7.1% |
| Immigrants | Azores | 0.0 /100 | #309 | Tragic 7.1% |
| Arapaho | 0.0 /100 | #310 | Tragic 7.1% |
| Cree | 0.0 /100 | #311 | Tragic 7.1% |
| Delaware | 0.0 /100 | #312 | Tragic 7.1% |
| Immigrants | Yemen | 0.0 /100 | #313 | Tragic 7.1% |
| Blackfeet | 0.0 /100 | #314 | Tragic 7.1% |
| Shoshone | 0.0 /100 | #315 | Tragic 7.1% |
| Immigrants | Dominican Republic | 0.0 /100 | #316 | Tragic 7.1% |
Demographics Similar to Hungarians by Ambulatory Disability
In terms of ambulatory disability, the demographic groups most similar to Hungarians are Immigrants from Albania (6.3%, a difference of 0.010%), German Russian (6.3%, a difference of 0.030%), Indonesian (6.3%, a difference of 0.050%), Guamanian/Chamorro (6.3%, a difference of 0.14%), and Yugoslavian (6.3%, a difference of 0.18%).
| Demographics | Rating | Rank | Ambulatory Disability |
| Immigrants | Mexico | 11.0 /100 | #214 | Poor 6.3% |
| Immigrants | Latin America | 11.0 /100 | #215 | Poor 6.3% |
| Canadians | 10.9 /100 | #216 | Poor 6.3% |
| Yugoslavians | 10.9 /100 | #217 | Poor 6.3% |
| Guamanians/Chamorros | 10.6 /100 | #218 | Poor 6.3% |
| Indonesians | 9.9 /100 | #219 | Tragic 6.3% |
| Immigrants | Albania | 9.6 /100 | #220 | Tragic 6.3% |
| Hungarians | 9.6 /100 | #221 | Tragic 6.3% |
| German Russians | 9.4 /100 | #222 | Tragic 6.3% |
| Immigrants | Honduras | 7.6 /100 | #223 | Tragic 6.3% |
| Liberians | 7.1 /100 | #224 | Tragic 6.3% |
| Hondurans | 6.3 /100 | #225 | Tragic 6.3% |
| Slavs | 5.1 /100 | #226 | Tragic 6.4% |
| Cubans | 4.0 /100 | #227 | Tragic 6.4% |
| Portuguese | 4.0 /100 | #228 | Tragic 6.4% |