Immigrants from Australia vs Senegalese Vision Disability
COMPARE
Immigrants from Australia
Senegalese
Vision Disability
Vision Disability Comparison
Immigrants from Australia
Senegalese
1.9%
VISION DISABILITY
99.8/ 100
METRIC RATING
35th/ 347
METRIC RANK
2.4%
VISION DISABILITY
0.1/ 100
METRIC RATING
268th/ 347
METRIC RANK
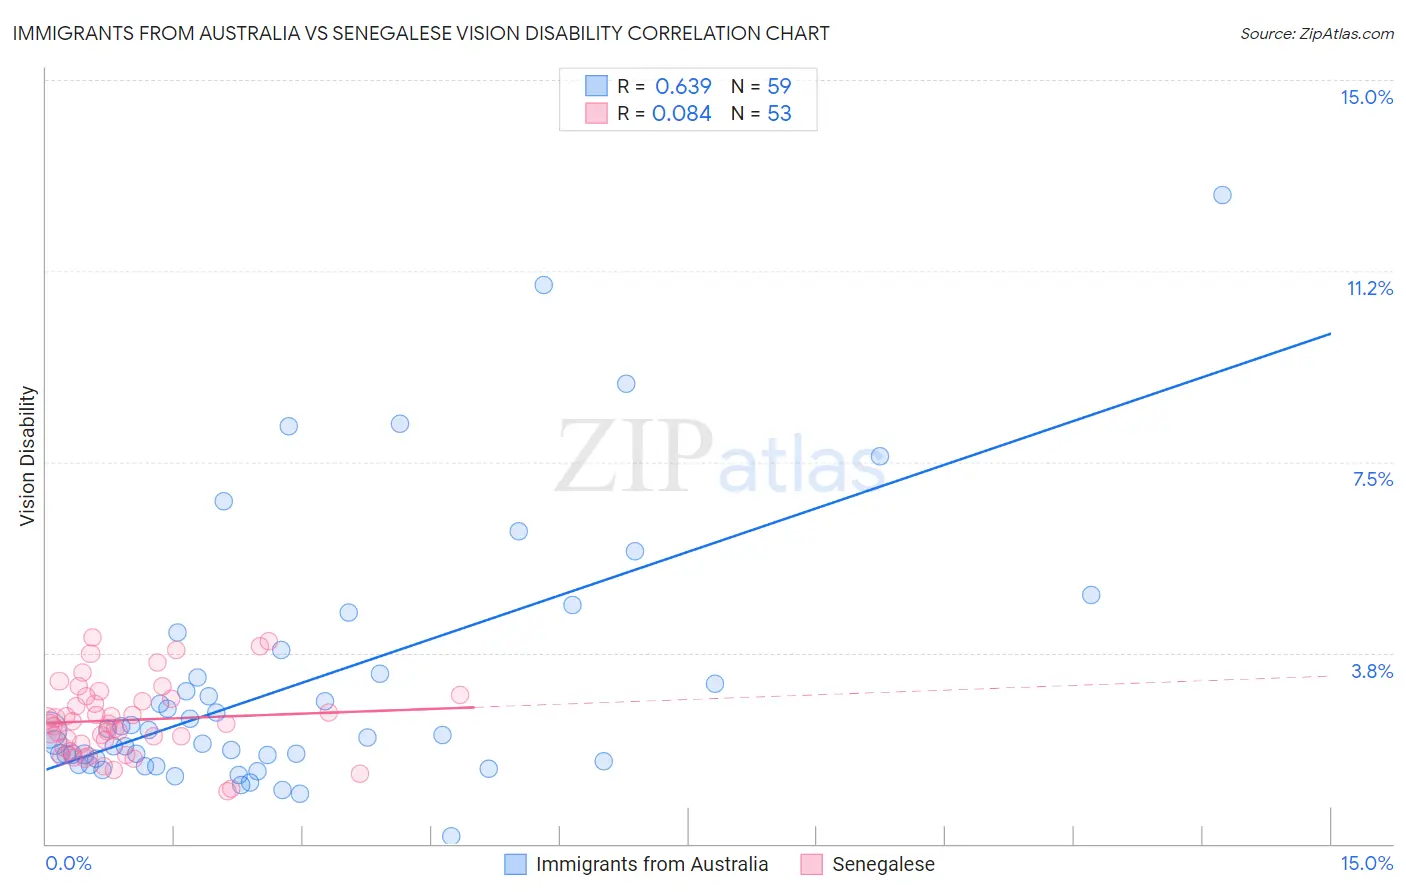
Immigrants from Australia vs Senegalese Vision Disability Correlation Chart
The statistical analysis conducted on geographies consisting of 227,117,952 people shows a significant positive correlation between the proportion of Immigrants from Australia and percentage of population with vision disability in the United States with a correlation coefficient (R) of 0.639 and weighted average of 1.9%. Similarly, the statistical analysis conducted on geographies consisting of 78,129,878 people shows a slight positive correlation between the proportion of Senegalese and percentage of population with vision disability in the United States with a correlation coefficient (R) of 0.084 and weighted average of 2.4%, a difference of 23.2%.
Vision Disability Correlation Summary
| Measurement | Immigrants from Australia | Senegalese |
| Minimum | 0.16% | 1.0% |
| Maximum | 12.7% | 4.0% |
| Range | 12.6% | 3.0% |
| Mean | 3.1% | 2.4% |
| Median | 2.1% | 2.4% |
| Interquartile 25% (IQ1) | 1.6% | 1.9% |
| Interquartile 75% (IQ3) | 3.3% | 2.9% |
| Interquartile Range (IQR) | 1.7% | 0.95% |
| Standard Deviation (Sample) | 2.6% | 0.72% |
| Standard Deviation (Population) | 2.5% | 0.72% |
Similar Demographics by Vision Disability
Demographics Similar to Immigrants from Australia by Vision Disability
In terms of vision disability, the demographic groups most similar to Immigrants from Australia are Immigrants from Turkey (1.9%, a difference of 0.10%), Immigrants from Egypt (1.9%, a difference of 0.22%), Cambodian (2.0%, a difference of 0.35%), Luxembourger (1.9%, a difference of 0.53%), and Bhutanese (2.0%, a difference of 0.60%).
| Demographics | Rating | Rank | Vision Disability |
| Immigrants | Malaysia | 99.9 /100 | #28 | Exceptional 1.9% |
| Egyptians | 99.9 /100 | #29 | Exceptional 1.9% |
| Immigrants | Nepal | 99.9 /100 | #30 | Exceptional 1.9% |
| Mongolians | 99.9 /100 | #31 | Exceptional 1.9% |
| Luxembourgers | 99.9 /100 | #32 | Exceptional 1.9% |
| Immigrants | Egypt | 99.9 /100 | #33 | Exceptional 1.9% |
| Immigrants | Turkey | 99.8 /100 | #34 | Exceptional 1.9% |
| Immigrants | Australia | 99.8 /100 | #35 | Exceptional 1.9% |
| Cambodians | 99.8 /100 | #36 | Exceptional 2.0% |
| Bhutanese | 99.8 /100 | #37 | Exceptional 2.0% |
| Immigrants | Kuwait | 99.8 /100 | #38 | Exceptional 2.0% |
| Zimbabweans | 99.7 /100 | #39 | Exceptional 2.0% |
| Immigrants | Ireland | 99.7 /100 | #40 | Exceptional 2.0% |
| Cypriots | 99.7 /100 | #41 | Exceptional 2.0% |
| Immigrants | Ethiopia | 99.7 /100 | #42 | Exceptional 2.0% |
Demographics Similar to Senegalese by Vision Disability
In terms of vision disability, the demographic groups most similar to Senegalese are Ute (2.4%, a difference of 0.090%), Mexican American Indian (2.4%, a difference of 0.10%), Immigrants from Jamaica (2.4%, a difference of 0.14%), Immigrants from Liberia (2.4%, a difference of 0.16%), and Celtic (2.4%, a difference of 0.27%).
| Demographics | Rating | Rank | Vision Disability |
| Fijians | 0.1 /100 | #261 | Tragic 2.4% |
| Jamaicans | 0.1 /100 | #262 | Tragic 2.4% |
| Immigrants | Belize | 0.1 /100 | #263 | Tragic 2.4% |
| Immigrants | Liberia | 0.1 /100 | #264 | Tragic 2.4% |
| Immigrants | Jamaica | 0.1 /100 | #265 | Tragic 2.4% |
| Mexican American Indians | 0.1 /100 | #266 | Tragic 2.4% |
| Ute | 0.1 /100 | #267 | Tragic 2.4% |
| Senegalese | 0.1 /100 | #268 | Tragic 2.4% |
| Celtics | 0.1 /100 | #269 | Tragic 2.4% |
| Cubans | 0.1 /100 | #270 | Tragic 2.4% |
| Immigrants | Azores | 0.1 /100 | #271 | Tragic 2.4% |
| Spaniards | 0.1 /100 | #272 | Tragic 2.4% |
| Immigrants | Bahamas | 0.1 /100 | #273 | Tragic 2.4% |
| Immigrants | Latin America | 0.0 /100 | #274 | Tragic 2.4% |
| Chippewa | 0.0 /100 | #275 | Tragic 2.4% |