Immigrants from Australia vs Cajun Cognitive Disability
COMPARE
Immigrants from Australia
Cajun
Cognitive Disability
Cognitive Disability Comparison
Immigrants from Australia
Cajuns
17.1%
COGNITIVE DISABILITY
76.0/ 100
METRIC RATING
157th/ 347
METRIC RANK
17.8%
COGNITIVE DISABILITY
1.4/ 100
METRIC RATING
239th/ 347
METRIC RANK
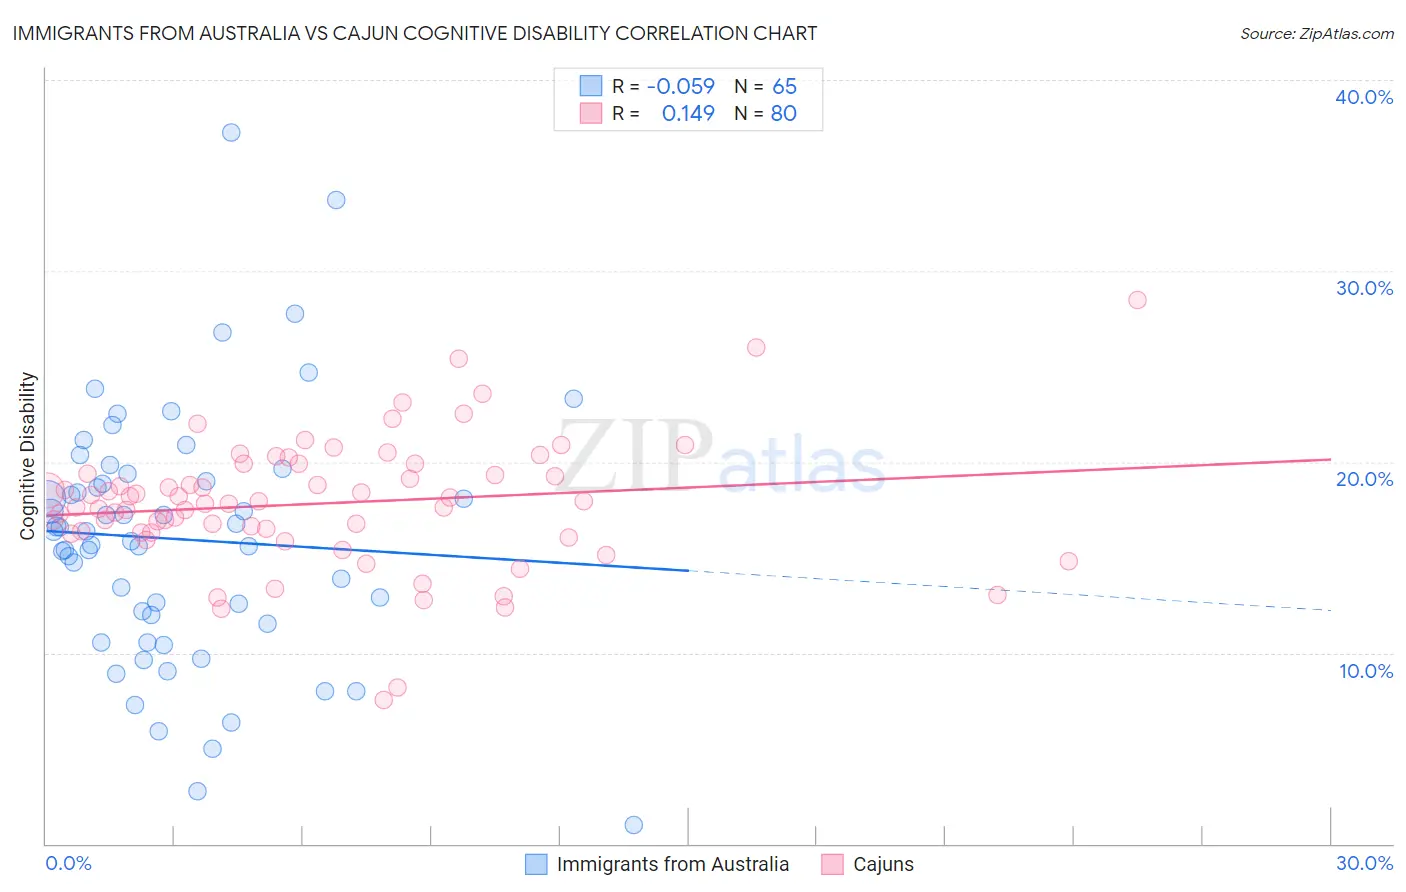
Immigrants from Australia vs Cajun Cognitive Disability Correlation Chart
The statistical analysis conducted on geographies consisting of 227,201,073 people shows a slight negative correlation between the proportion of Immigrants from Australia and percentage of population with cognitive disability in the United States with a correlation coefficient (R) of -0.059 and weighted average of 17.1%. Similarly, the statistical analysis conducted on geographies consisting of 149,701,580 people shows a poor positive correlation between the proportion of Cajuns and percentage of population with cognitive disability in the United States with a correlation coefficient (R) of 0.149 and weighted average of 17.8%, a difference of 3.9%.
Cognitive Disability Correlation Summary
| Measurement | Immigrants from Australia | Cajun |
| Minimum | 0.98% | 7.5% |
| Maximum | 37.3% | 28.5% |
| Range | 36.3% | 20.9% |
| Mean | 15.9% | 17.8% |
| Median | 16.4% | 17.9% |
| Interquartile 25% (IQ1) | 11.8% | 16.3% |
| Interquartile 75% (IQ3) | 19.2% | 19.6% |
| Interquartile Range (IQR) | 7.4% | 3.4% |
| Standard Deviation (Sample) | 6.6% | 3.4% |
| Standard Deviation (Population) | 6.5% | 3.4% |
Similar Demographics by Cognitive Disability
Demographics Similar to Immigrants from Australia by Cognitive Disability
In terms of cognitive disability, the demographic groups most similar to Immigrants from Australia are Celtic (17.1%, a difference of 0.070%), Immigrants from Latvia (17.2%, a difference of 0.11%), Brazilian (17.1%, a difference of 0.12%), Sri Lankan (17.1%, a difference of 0.12%), and Immigrants from Malaysia (17.1%, a difference of 0.14%).
| Demographics | Rating | Rank | Cognitive Disability |
| Basques | 85.5 /100 | #150 | Excellent 17.1% |
| Syrians | 83.0 /100 | #151 | Excellent 17.1% |
| Immigrants | Indonesia | 82.7 /100 | #152 | Excellent 17.1% |
| Immigrants | Kazakhstan | 80.5 /100 | #153 | Excellent 17.1% |
| Immigrants | Malaysia | 79.3 /100 | #154 | Good 17.1% |
| Brazilians | 78.9 /100 | #155 | Good 17.1% |
| Sri Lankans | 78.9 /100 | #156 | Good 17.1% |
| Immigrants | Australia | 76.0 /100 | #157 | Good 17.1% |
| Celtics | 74.1 /100 | #158 | Good 17.1% |
| Immigrants | Latvia | 73.2 /100 | #159 | Good 17.2% |
| Australians | 72.4 /100 | #160 | Good 17.2% |
| Americans | 72.2 /100 | #161 | Good 17.2% |
| Yugoslavians | 71.6 /100 | #162 | Good 17.2% |
| Immigrants | Switzerland | 71.5 /100 | #163 | Good 17.2% |
| Armenians | 70.1 /100 | #164 | Good 17.2% |
Demographics Similar to Cajuns by Cognitive Disability
In terms of cognitive disability, the demographic groups most similar to Cajuns are Iraqi (17.8%, a difference of 0.040%), Cheyenne (17.8%, a difference of 0.13%), Immigrants from Mexico (17.8%, a difference of 0.16%), Immigrants from Iraq (17.8%, a difference of 0.17%), and Mexican (17.8%, a difference of 0.18%).
| Demographics | Rating | Rank | Cognitive Disability |
| Tongans | 2.1 /100 | #232 | Tragic 17.8% |
| Panamanians | 2.1 /100 | #233 | Tragic 17.8% |
| Osage | 2.0 /100 | #234 | Tragic 17.8% |
| Spanish American Indians | 2.0 /100 | #235 | Tragic 17.8% |
| Immigrants | Iraq | 1.8 /100 | #236 | Tragic 17.8% |
| Immigrants | Mexico | 1.8 /100 | #237 | Tragic 17.8% |
| Cheyenne | 1.7 /100 | #238 | Tragic 17.8% |
| Cajuns | 1.4 /100 | #239 | Tragic 17.8% |
| Iraqis | 1.4 /100 | #240 | Tragic 17.8% |
| Mexicans | 1.1 /100 | #241 | Tragic 17.8% |
| Paiute | 1.1 /100 | #242 | Tragic 17.8% |
| Immigrants | Bangladesh | 1.0 /100 | #243 | Tragic 17.8% |
| Jamaicans | 0.9 /100 | #244 | Tragic 17.9% |
| Trinidadians and Tobagonians | 0.8 /100 | #245 | Tragic 17.9% |
| Immigrants | Thailand | 0.8 /100 | #246 | Tragic 17.9% |