Immigrants from Asia vs Soviet Union Disability Age 35 to 64
COMPARE
Immigrants from Asia
Soviet Union
Disability Age 35 to 64
Disability Age 35 to 64 Comparison
Immigrants from Asia
Soviet Union
9.5%
DISABILITY AGE 35 TO 64
100.0/ 100
METRIC RATING
27th/ 347
METRIC RANK
9.2%
DISABILITY AGE 35 TO 64
100.0/ 100
METRIC RATING
18th/ 347
METRIC RANK
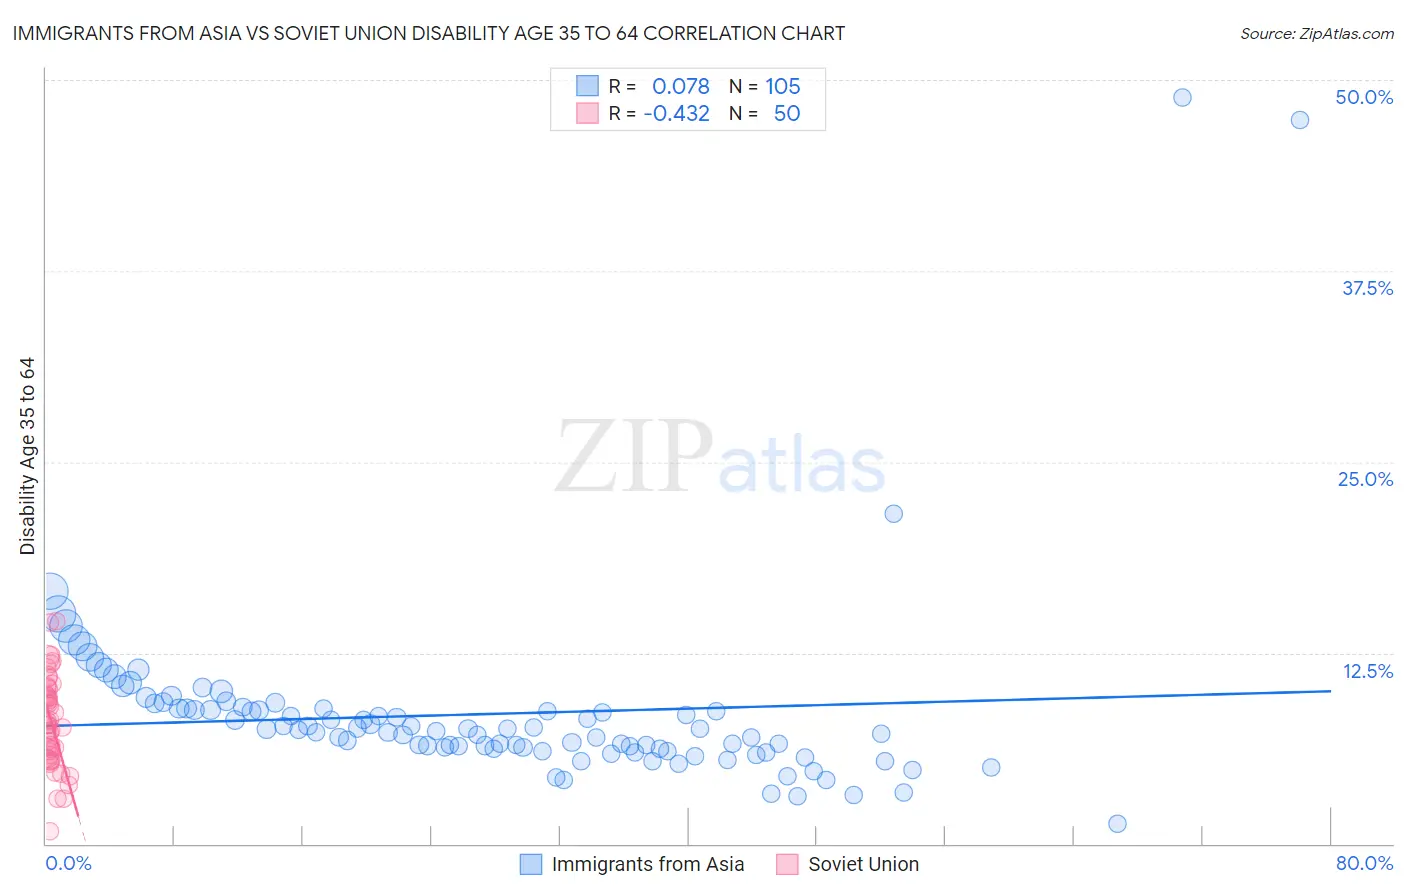
Immigrants from Asia vs Soviet Union Disability Age 35 to 64 Correlation Chart
The statistical analysis conducted on geographies consisting of 548,275,294 people shows a slight positive correlation between the proportion of Immigrants from Asia and percentage of population with a disability between the ages 34 and 64 in the United States with a correlation coefficient (R) of 0.078 and weighted average of 9.5%. Similarly, the statistical analysis conducted on geographies consisting of 43,509,630 people shows a moderate negative correlation between the proportion of Soviet Union and percentage of population with a disability between the ages 34 and 64 in the United States with a correlation coefficient (R) of -0.432 and weighted average of 9.2%, a difference of 2.5%.
Disability Age 35 to 64 Correlation Summary
| Measurement | Immigrants from Asia | Soviet Union |
| Minimum | 1.3% | 0.79% |
| Maximum | 48.8% | 14.6% |
| Range | 47.6% | 13.8% |
| Mean | 8.5% | 8.0% |
| Median | 7.5% | 7.8% |
| Interquartile 25% (IQ1) | 6.2% | 5.8% |
| Interquartile 75% (IQ3) | 8.8% | 10.1% |
| Interquartile Range (IQR) | 2.6% | 4.3% |
| Standard Deviation (Sample) | 6.2% | 3.0% |
| Standard Deviation (Population) | 6.2% | 2.9% |
Demographics Similar to Immigrants from Asia and Soviet Union by Disability Age 35 to 64
In terms of disability age 35 to 64, the demographic groups most similar to Immigrants from Asia are Immigrants from Pakistan (9.5%, a difference of 0.17%), Immigrants from Sri Lanka (9.5%, a difference of 0.22%), Immigrants from Ireland (9.5%, a difference of 0.62%), Immigrants from Japan (9.5%, a difference of 0.66%), and Venezuelan (9.4%, a difference of 0.72%). Similarly, the demographic groups most similar to Soviet Union are Immigrants from Venezuela (9.3%, a difference of 0.24%), Burmese (9.2%, a difference of 0.41%), Immigrants from Argentina (9.3%, a difference of 0.75%), Okinawan (9.4%, a difference of 1.2%), and Cypriot (9.4%, a difference of 1.2%).
| Demographics | Rating | Rank | Disability Age 35 to 64 |
| Indians (Asian) | 100.0 /100 | #12 | Exceptional 8.9% |
| Immigrants | South Central Asia | 100.0 /100 | #13 | Exceptional 8.9% |
| Immigrants | Singapore | 100.0 /100 | #14 | Exceptional 8.9% |
| Bolivians | 100.0 /100 | #15 | Exceptional 8.9% |
| Immigrants | Korea | 100.0 /100 | #16 | Exceptional 9.0% |
| Burmese | 100.0 /100 | #17 | Exceptional 9.2% |
| Soviet Union | 100.0 /100 | #18 | Exceptional 9.2% |
| Immigrants | Venezuela | 100.0 /100 | #19 | Exceptional 9.3% |
| Immigrants | Argentina | 100.0 /100 | #20 | Exceptional 9.3% |
| Okinawans | 100.0 /100 | #21 | Exceptional 9.4% |
| Cypriots | 100.0 /100 | #22 | Exceptional 9.4% |
| Argentineans | 100.0 /100 | #23 | Exceptional 9.4% |
| Asians | 100.0 /100 | #24 | Exceptional 9.4% |
| Venezuelans | 100.0 /100 | #25 | Exceptional 9.4% |
| Immigrants | Sri Lanka | 100.0 /100 | #26 | Exceptional 9.5% |
| Immigrants | Asia | 100.0 /100 | #27 | Exceptional 9.5% |
| Immigrants | Pakistan | 100.0 /100 | #28 | Exceptional 9.5% |
| Immigrants | Ireland | 100.0 /100 | #29 | Exceptional 9.5% |
| Immigrants | Japan | 100.0 /100 | #30 | Exceptional 9.5% |
| Immigrants | Lithuania | 99.9 /100 | #31 | Exceptional 9.6% |
| Turks | 99.9 /100 | #32 | Exceptional 9.7% |