Immigrants from Asia vs Lumbee Ambulatory Disability
COMPARE
Immigrants from Asia
Lumbee
Ambulatory Disability
Ambulatory Disability Comparison
Immigrants from Asia
Lumbee
5.5%
AMBULATORY DISABILITY
100.0/ 100
METRIC RATING
34th/ 347
METRIC RANK
9.5%
AMBULATORY DISABILITY
0.0/ 100
METRIC RATING
347th/ 347
METRIC RANK
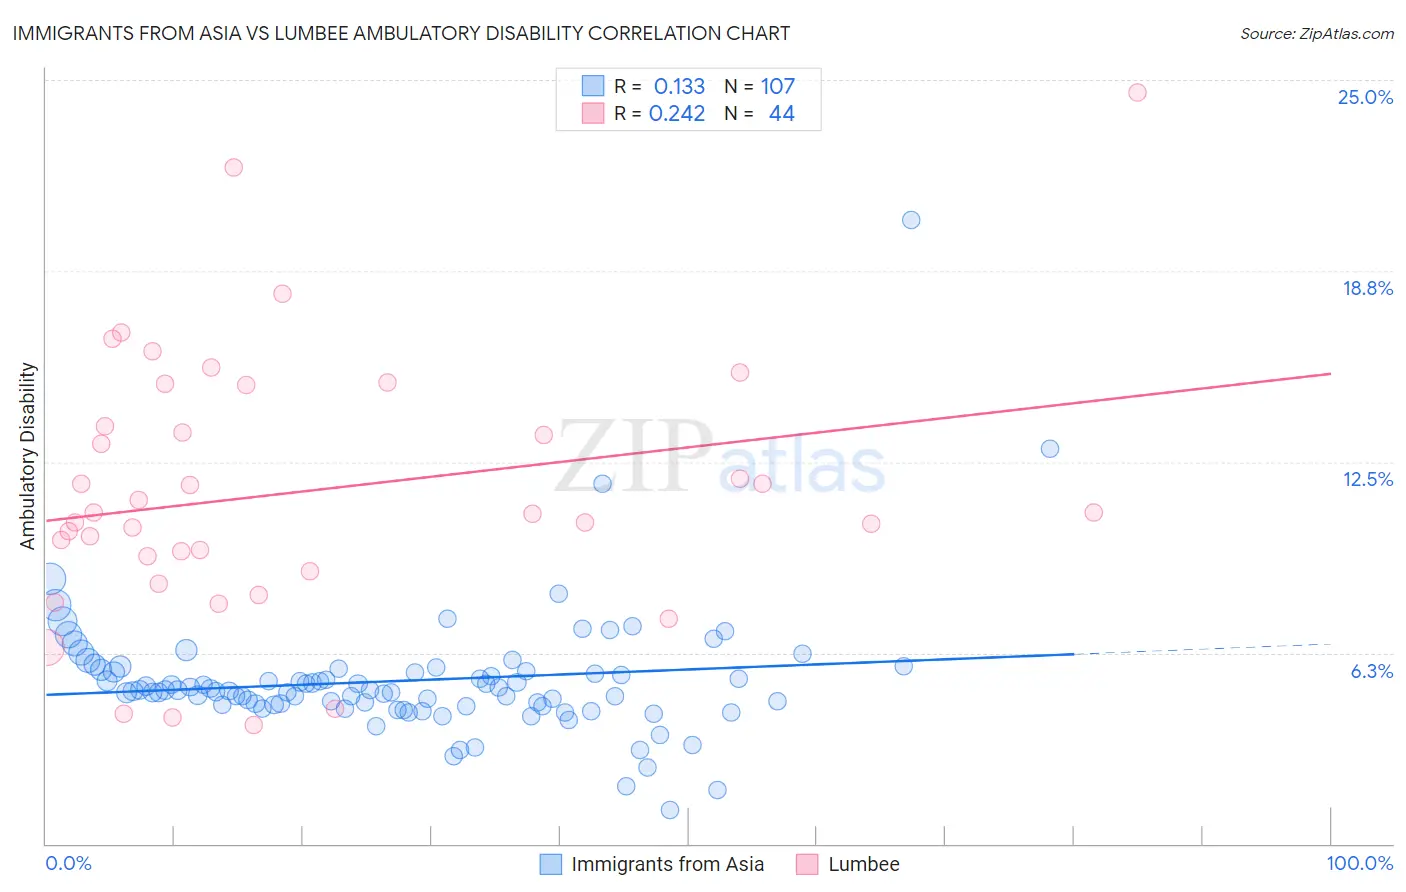
Immigrants from Asia vs Lumbee Ambulatory Disability Correlation Chart
The statistical analysis conducted on geographies consisting of 548,709,972 people shows a poor positive correlation between the proportion of Immigrants from Asia and percentage of population with ambulatory disability in the United States with a correlation coefficient (R) of 0.133 and weighted average of 5.5%. Similarly, the statistical analysis conducted on geographies consisting of 92,273,744 people shows a weak positive correlation between the proportion of Lumbee and percentage of population with ambulatory disability in the United States with a correlation coefficient (R) of 0.242 and weighted average of 9.5%, a difference of 74.3%.
Ambulatory Disability Correlation Summary
| Measurement | Immigrants from Asia | Lumbee |
| Minimum | 1.1% | 3.9% |
| Maximum | 20.4% | 24.6% |
| Range | 19.3% | 20.7% |
| Mean | 5.3% | 11.5% |
| Median | 5.0% | 10.8% |
| Interquartile 25% (IQ1) | 4.5% | 9.2% |
| Interquartile 75% (IQ3) | 5.6% | 14.3% |
| Interquartile Range (IQR) | 1.1% | 5.2% |
| Standard Deviation (Sample) | 2.1% | 4.4% |
| Standard Deviation (Population) | 2.1% | 4.3% |
Similar Demographics by Ambulatory Disability
Demographics Similar to Immigrants from Asia by Ambulatory Disability
In terms of ambulatory disability, the demographic groups most similar to Immigrants from Asia are Afghan (5.5%, a difference of 0.040%), Immigrants from Malaysia (5.5%, a difference of 0.11%), Turkish (5.5%, a difference of 0.13%), Cypriot (5.5%, a difference of 0.13%), and Immigrants from Pakistan (5.5%, a difference of 0.16%).
| Demographics | Rating | Rank | Ambulatory Disability |
| Asians | 100.0 /100 | #27 | Exceptional 5.4% |
| Cambodians | 100.0 /100 | #28 | Exceptional 5.4% |
| Immigrants | Iran | 100.0 /100 | #29 | Exceptional 5.4% |
| Immigrants | Turkey | 100.0 /100 | #30 | Exceptional 5.4% |
| Immigrants | Venezuela | 100.0 /100 | #31 | Exceptional 5.4% |
| Immigrants | Australia | 100.0 /100 | #32 | Exceptional 5.5% |
| Immigrants | Pakistan | 100.0 /100 | #33 | Exceptional 5.5% |
| Immigrants | Asia | 100.0 /100 | #34 | Exceptional 5.5% |
| Afghans | 100.0 /100 | #35 | Exceptional 5.5% |
| Immigrants | Malaysia | 100.0 /100 | #36 | Exceptional 5.5% |
| Turks | 100.0 /100 | #37 | Exceptional 5.5% |
| Cypriots | 100.0 /100 | #38 | Exceptional 5.5% |
| Immigrants | Eritrea | 100.0 /100 | #39 | Exceptional 5.5% |
| Venezuelans | 99.9 /100 | #40 | Exceptional 5.5% |
| Mongolians | 99.9 /100 | #41 | Exceptional 5.5% |
Demographics Similar to Lumbee by Ambulatory Disability
In terms of ambulatory disability, the demographic groups most similar to Lumbee are Houma (9.3%, a difference of 2.5%), Puerto Rican (8.9%, a difference of 7.5%), Tsimshian (8.8%, a difference of 8.2%), Tohono O'odham (8.7%, a difference of 9.2%), and Kiowa (8.6%, a difference of 10.8%).
| Demographics | Rating | Rank | Ambulatory Disability |
| Cherokee | 0.0 /100 | #333 | Tragic 7.9% |
| Yuman | 0.0 /100 | #334 | Tragic 7.9% |
| Chickasaw | 0.0 /100 | #335 | Tragic 8.0% |
| Seminole | 0.0 /100 | #336 | Tragic 8.0% |
| Dutch West Indians | 0.0 /100 | #337 | Tragic 8.2% |
| Colville | 0.0 /100 | #338 | Tragic 8.2% |
| Pima | 0.0 /100 | #339 | Tragic 8.2% |
| Choctaw | 0.0 /100 | #340 | Tragic 8.3% |
| Creek | 0.0 /100 | #341 | Tragic 8.5% |
| Kiowa | 0.0 /100 | #342 | Tragic 8.6% |
| Tohono O'odham | 0.0 /100 | #343 | Tragic 8.7% |
| Tsimshian | 0.0 /100 | #344 | Tragic 8.8% |
| Puerto Ricans | 0.0 /100 | #345 | Tragic 8.9% |
| Houma | 0.0 /100 | #346 | Tragic 9.3% |
| Lumbee | 0.0 /100 | #347 | Tragic 9.5% |