Immigrants from Armenia vs Immigrants from Honduras Cognitive Disability
COMPARE
Immigrants from Armenia
Immigrants from Honduras
Cognitive Disability
Cognitive Disability Comparison
Immigrants from Armenia
Immigrants from Honduras
17.9%
COGNITIVE DISABILITY
0.6/ 100
METRIC RATING
258th/ 347
METRIC RANK
18.0%
COGNITIVE DISABILITY
0.2/ 100
METRIC RATING
272nd/ 347
METRIC RANK
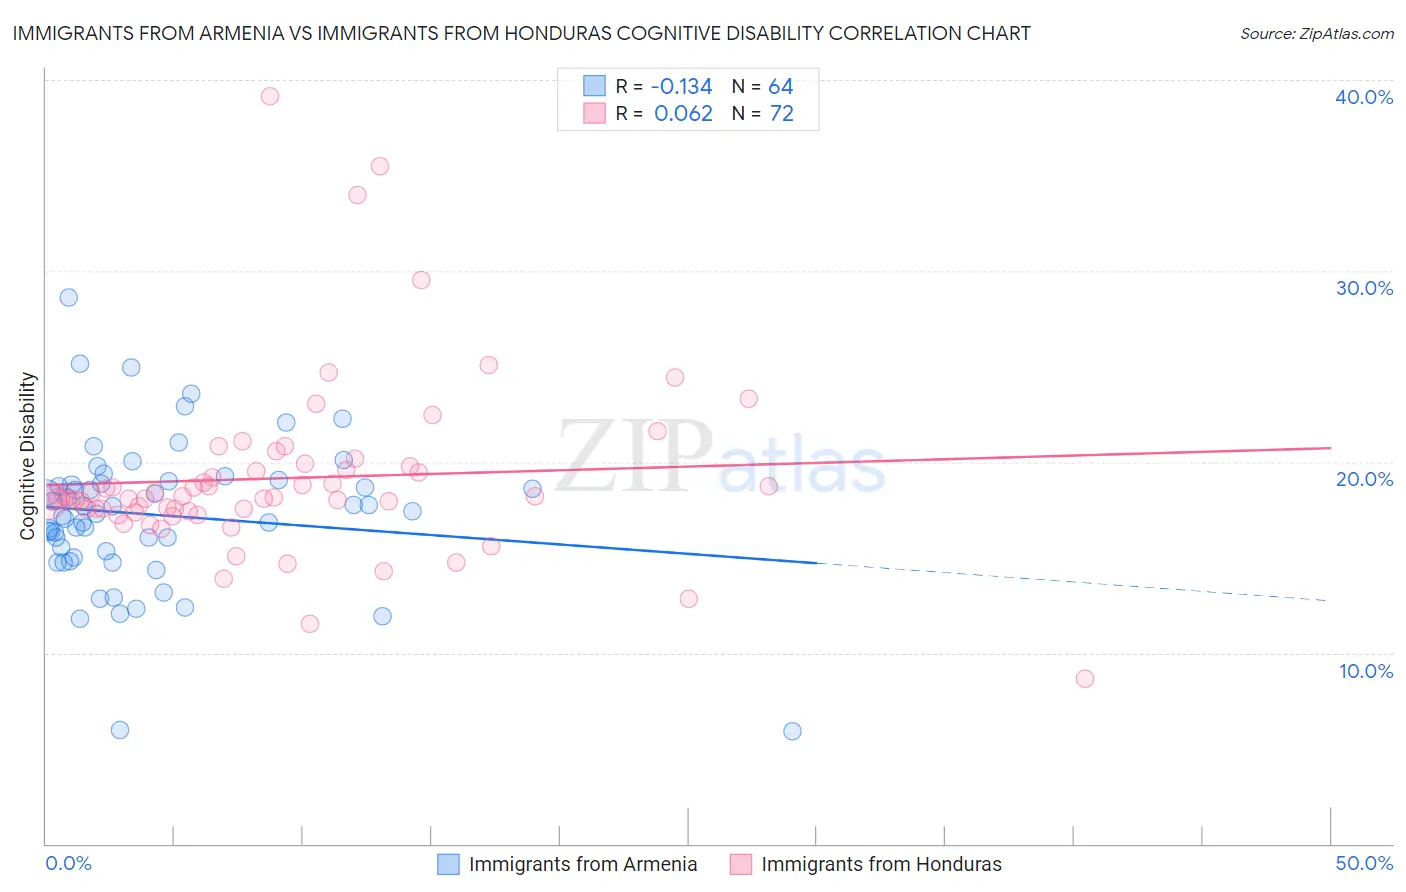
Immigrants from Armenia vs Immigrants from Honduras Cognitive Disability Correlation Chart
The statistical analysis conducted on geographies consisting of 97,717,666 people shows a poor negative correlation between the proportion of Immigrants from Armenia and percentage of population with cognitive disability in the United States with a correlation coefficient (R) of -0.134 and weighted average of 17.9%. Similarly, the statistical analysis conducted on geographies consisting of 322,550,797 people shows a slight positive correlation between the proportion of Immigrants from Honduras and percentage of population with cognitive disability in the United States with a correlation coefficient (R) of 0.062 and weighted average of 18.0%, a difference of 0.61%.
Cognitive Disability Correlation Summary
| Measurement | Immigrants from Armenia | Immigrants from Honduras |
| Minimum | 5.9% | 8.7% |
| Maximum | 28.6% | 39.1% |
| Range | 22.7% | 30.5% |
| Mean | 17.2% | 19.1% |
| Median | 17.4% | 18.1% |
| Interquartile 25% (IQ1) | 15.2% | 17.5% |
| Interquartile 75% (IQ3) | 18.9% | 19.7% |
| Interquartile Range (IQR) | 3.8% | 2.2% |
| Standard Deviation (Sample) | 3.9% | 4.7% |
| Standard Deviation (Population) | 3.9% | 4.7% |
Demographics Similar to Immigrants from Armenia and Immigrants from Honduras by Cognitive Disability
In terms of cognitive disability, the demographic groups most similar to Immigrants from Armenia are Mexican American Indian (17.9%, a difference of 0.010%), Immigrants from the Azores (17.9%, a difference of 0.050%), Bahamian (17.9%, a difference of 0.050%), Ethiopian (17.9%, a difference of 0.080%), and Immigrants from Belize (17.9%, a difference of 0.090%). Similarly, the demographic groups most similar to Immigrants from Honduras are Potawatomi (18.0%, a difference of 0.010%), Immigrants from Bahamas (18.0%, a difference of 0.090%), Honduran (18.0%, a difference of 0.10%), Immigrants from Nepal (18.0%, a difference of 0.12%), and Immigrants from Nigeria (18.0%, a difference of 0.13%).
| Demographics | Rating | Rank | Cognitive Disability |
| Immigrants | Azores | 0.6 /100 | #255 | Tragic 17.9% |
| Bahamians | 0.6 /100 | #256 | Tragic 17.9% |
| Mexican American Indians | 0.6 /100 | #257 | Tragic 17.9% |
| Immigrants | Armenia | 0.6 /100 | #258 | Tragic 17.9% |
| Ethiopians | 0.5 /100 | #259 | Tragic 17.9% |
| Immigrants | Belize | 0.5 /100 | #260 | Tragic 17.9% |
| Guamanians/Chamorros | 0.5 /100 | #261 | Tragic 17.9% |
| Sierra Leoneans | 0.4 /100 | #262 | Tragic 17.9% |
| Immigrants | Barbados | 0.4 /100 | #263 | Tragic 17.9% |
| Menominee | 0.4 /100 | #264 | Tragic 18.0% |
| Spanish Americans | 0.4 /100 | #265 | Tragic 18.0% |
| Belizeans | 0.4 /100 | #266 | Tragic 18.0% |
| Nepalese | 0.3 /100 | #267 | Tragic 18.0% |
| Cherokee | 0.3 /100 | #268 | Tragic 18.0% |
| Hondurans | 0.3 /100 | #269 | Tragic 18.0% |
| Immigrants | Bahamas | 0.3 /100 | #270 | Tragic 18.0% |
| Potawatomi | 0.2 /100 | #271 | Tragic 18.0% |
| Immigrants | Honduras | 0.2 /100 | #272 | Tragic 18.0% |
| Immigrants | Nepal | 0.2 /100 | #273 | Tragic 18.0% |
| Immigrants | Nigeria | 0.2 /100 | #274 | Tragic 18.0% |
| Immigrants | Laos | 0.2 /100 | #275 | Tragic 18.1% |