Immigrants from Armenia vs Crow Vision Disability
COMPARE
Immigrants from Armenia
Crow
Vision Disability
Vision Disability Comparison
Immigrants from Armenia
Crow
2.1%
VISION DISABILITY
93.8/ 100
METRIC RATING
110th/ 347
METRIC RANK
2.5%
VISION DISABILITY
0.0/ 100
METRIC RATING
292nd/ 347
METRIC RANK
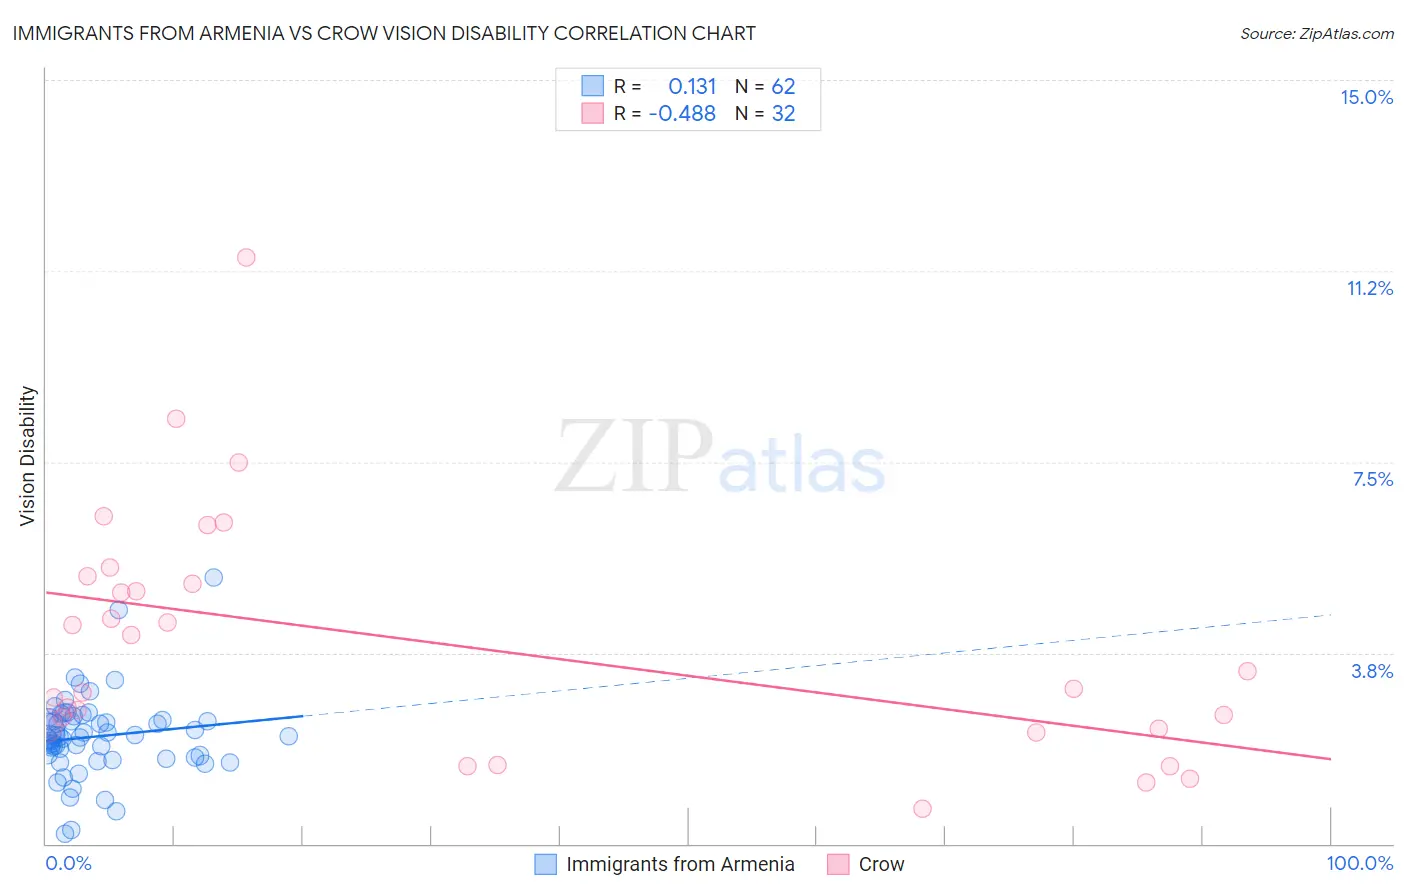
Immigrants from Armenia vs Crow Vision Disability Correlation Chart
The statistical analysis conducted on geographies consisting of 97,705,709 people shows a poor positive correlation between the proportion of Immigrants from Armenia and percentage of population with vision disability in the United States with a correlation coefficient (R) of 0.131 and weighted average of 2.1%. Similarly, the statistical analysis conducted on geographies consisting of 59,186,790 people shows a moderate negative correlation between the proportion of Crow and percentage of population with vision disability in the United States with a correlation coefficient (R) of -0.488 and weighted average of 2.5%, a difference of 20.3%.
Vision Disability Correlation Summary
| Measurement | Immigrants from Armenia | Crow |
| Minimum | 0.20% | 0.69% |
| Maximum | 5.2% | 11.5% |
| Range | 5.0% | 10.8% |
| Mean | 2.1% | 3.9% |
| Median | 2.1% | 3.2% |
| Interquartile 25% (IQ1) | 1.7% | 2.3% |
| Interquartile 75% (IQ3) | 2.4% | 5.2% |
| Interquartile Range (IQR) | 0.76% | 2.9% |
| Standard Deviation (Sample) | 0.82% | 2.4% |
| Standard Deviation (Population) | 0.81% | 2.3% |
Similar Demographics by Vision Disability
Demographics Similar to Immigrants from Armenia by Vision Disability
In terms of vision disability, the demographic groups most similar to Immigrants from Armenia are Peruvian (2.1%, a difference of 0.060%), Chilean (2.1%, a difference of 0.070%), Korean (2.1%, a difference of 0.090%), Swedish (2.1%, a difference of 0.12%), and Danish (2.1%, a difference of 0.12%).
| Demographics | Rating | Rank | Vision Disability |
| Immigrants | Austria | 94.4 /100 | #103 | Exceptional 2.1% |
| Immigrants | Italy | 94.4 /100 | #104 | Exceptional 2.1% |
| Carpatho Rusyns | 94.3 /100 | #105 | Exceptional 2.1% |
| Swedes | 94.2 /100 | #106 | Exceptional 2.1% |
| Danes | 94.2 /100 | #107 | Exceptional 2.1% |
| Koreans | 94.1 /100 | #108 | Exceptional 2.1% |
| Chileans | 94.0 /100 | #109 | Exceptional 2.1% |
| Immigrants | Armenia | 93.8 /100 | #110 | Exceptional 2.1% |
| Peruvians | 93.5 /100 | #111 | Exceptional 2.1% |
| Immigrants | Denmark | 92.9 /100 | #112 | Exceptional 2.1% |
| Kenyans | 92.5 /100 | #113 | Exceptional 2.1% |
| Croatians | 92.3 /100 | #114 | Exceptional 2.1% |
| Immigrants | Vietnam | 92.2 /100 | #115 | Exceptional 2.1% |
| Ugandans | 92.2 /100 | #116 | Exceptional 2.1% |
| Poles | 92.0 /100 | #117 | Exceptional 2.1% |
Demographics Similar to Crow by Vision Disability
In terms of vision disability, the demographic groups most similar to Crow are Yaqui (2.5%, a difference of 0.030%), Immigrants from Honduras (2.5%, a difference of 0.10%), Ottawa (2.5%, a difference of 0.36%), Immigrants from Cuba (2.5%, a difference of 0.49%), and Delaware (2.5%, a difference of 0.58%).
| Demographics | Rating | Rank | Vision Disability |
| Immigrants | Central America | 0.0 /100 | #285 | Tragic 2.5% |
| Sioux | 0.0 /100 | #286 | Tragic 2.5% |
| Hondurans | 0.0 /100 | #287 | Tragic 2.5% |
| French American Indians | 0.0 /100 | #288 | Tragic 2.5% |
| Immigrants | Nonimmigrants | 0.0 /100 | #289 | Tragic 2.5% |
| Immigrants | Cuba | 0.0 /100 | #290 | Tragic 2.5% |
| Immigrants | Honduras | 0.0 /100 | #291 | Tragic 2.5% |
| Crow | 0.0 /100 | #292 | Tragic 2.5% |
| Yaqui | 0.0 /100 | #293 | Tragic 2.5% |
| Ottawa | 0.0 /100 | #294 | Tragic 2.5% |
| Delaware | 0.0 /100 | #295 | Tragic 2.5% |
| Immigrants | Mexico | 0.0 /100 | #296 | Tragic 2.5% |
| Immigrants | Dominica | 0.0 /100 | #297 | Tragic 2.5% |
| Mexicans | 0.0 /100 | #298 | Tragic 2.5% |
| Cree | 0.0 /100 | #299 | Tragic 2.5% |