Immigrants from Argentina vs Greek Disability Age Over 75
COMPARE
Immigrants from Argentina
Greek
Disability Age Over 75
Disability Age Over 75 Comparison
Immigrants from Argentina
Greeks
45.9%
DISABILITY AGE OVER 75
99.6/ 100
METRIC RATING
61st/ 347
METRIC RANK
45.6%
DISABILITY AGE OVER 75
99.8/ 100
METRIC RATING
42nd/ 347
METRIC RANK
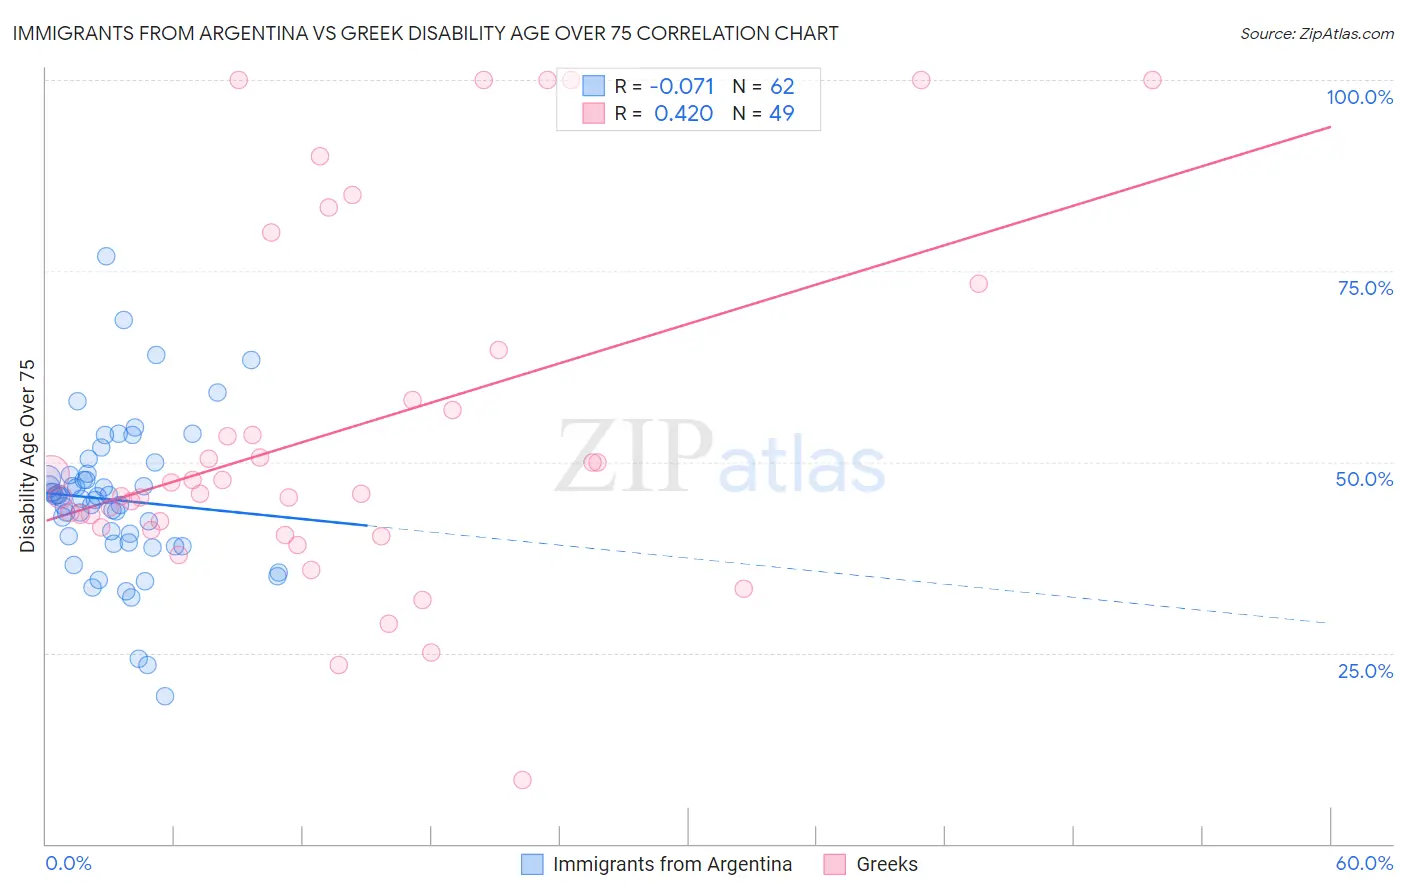
Immigrants from Argentina vs Greek Disability Age Over 75 Correlation Chart
The statistical analysis conducted on geographies consisting of 264,260,821 people shows a slight negative correlation between the proportion of Immigrants from Argentina and percentage of population with a disability over the age of 75 in the United States with a correlation coefficient (R) of -0.071 and weighted average of 45.9%. Similarly, the statistical analysis conducted on geographies consisting of 481,666,477 people shows a moderate positive correlation between the proportion of Greeks and percentage of population with a disability over the age of 75 in the United States with a correlation coefficient (R) of 0.420 and weighted average of 45.6%, a difference of 0.55%.
Disability Age Over 75 Correlation Summary
| Measurement | Immigrants from Argentina | Greek |
| Minimum | 19.4% | 8.3% |
| Maximum | 77.0% | 100.0% |
| Range | 57.6% | 91.7% |
| Mean | 45.0% | 54.1% |
| Median | 45.4% | 45.8% |
| Interquartile 25% (IQ1) | 39.5% | 41.2% |
| Interquartile 75% (IQ3) | 48.2% | 61.4% |
| Interquartile Range (IQR) | 8.7% | 20.2% |
| Standard Deviation (Sample) | 9.9% | 22.9% |
| Standard Deviation (Population) | 9.8% | 22.7% |
Demographics Similar to Immigrants from Argentina and Greeks by Disability Age Over 75
In terms of disability age over 75, the demographic groups most similar to Immigrants from Argentina are Iranian (45.9%, a difference of 0.020%), Immigrants from Europe (45.9%, a difference of 0.020%), Immigrants from Israel (45.9%, a difference of 0.030%), Immigrants from Turkey (45.9%, a difference of 0.040%), and Immigrants from Netherlands (45.9%, a difference of 0.050%). Similarly, the demographic groups most similar to Greeks are Czech (45.7%, a difference of 0.0%), Immigrants from Singapore (45.6%, a difference of 0.040%), Australian (45.7%, a difference of 0.040%), Turkish (45.7%, a difference of 0.040%), and Swedish (45.7%, a difference of 0.070%).
| Demographics | Rating | Rank | Disability Age Over 75 |
| Immigrants | Singapore | 99.8 /100 | #41 | Exceptional 45.6% |
| Greeks | 99.8 /100 | #42 | Exceptional 45.6% |
| Czechs | 99.8 /100 | #43 | Exceptional 45.7% |
| Australians | 99.8 /100 | #44 | Exceptional 45.7% |
| Turks | 99.8 /100 | #45 | Exceptional 45.7% |
| Swedes | 99.8 /100 | #46 | Exceptional 45.7% |
| Immigrants | Canada | 99.8 /100 | #47 | Exceptional 45.7% |
| Croatians | 99.8 /100 | #48 | Exceptional 45.7% |
| Immigrants | North America | 99.8 /100 | #49 | Exceptional 45.7% |
| Belgians | 99.7 /100 | #50 | Exceptional 45.8% |
| Immigrants | Korea | 99.7 /100 | #51 | Exceptional 45.8% |
| Immigrants | France | 99.7 /100 | #52 | Exceptional 45.8% |
| Immigrants | Italy | 99.7 /100 | #53 | Exceptional 45.8% |
| Slovaks | 99.6 /100 | #54 | Exceptional 45.8% |
| Maltese | 99.6 /100 | #55 | Exceptional 45.8% |
| Immigrants | Netherlands | 99.6 /100 | #56 | Exceptional 45.9% |
| Immigrants | Turkey | 99.6 /100 | #57 | Exceptional 45.9% |
| Immigrants | Israel | 99.6 /100 | #58 | Exceptional 45.9% |
| Iranians | 99.6 /100 | #59 | Exceptional 45.9% |
| Immigrants | Europe | 99.6 /100 | #60 | Exceptional 45.9% |
| Immigrants | Argentina | 99.6 /100 | #61 | Exceptional 45.9% |