Immigrants from Afghanistan vs Immigrants from Oceania Disability Age 65 to 74

COMPARE

Immigrants from Afghanistan
Race
Ancestry
AfghanAfricanAlaska NativeAlaskan AthabascanAlbanianAleutAlsatianAmericanApacheArabArapahoArgentineanArmenianAssyrian/Chaldean/SyriacAustralianAustrianBahamianBangladeshiBarbadianBasqueBelgianBelizeanBermudanBhutaneseBlackfeetBolivianBrazilianBritishBritish West IndianBulgarianBurmeseCajunCambodianCanadianCape VerdeanCarpatho RusynCelticCentral AmericanCentral American IndianCherokeeCheyenneChickasawChileanChineseChippewaChoctawColombianColvilleComancheCosta RicanCreeCreekCroatianCrowCubanCypriotCzechCzechoslovakianDanishDelawareDominicanDutchDutch West IndianEastern EuropeanEcuadorianEgyptianEnglishEstonianEthiopianEuropeanFijianFilipinoFinnishFrenchFrench American IndianFrench CanadianGermanGerman RussianGhanaianGreekGuamanian/ChamorroGuatemalanGuyaneseHaitianHmongHonduranHopiHoumaHungarianIcelanderIndian (Asian)IndonesianInupiatIranianIraqiIrishIroquoisIsraeliItalianJamaicanJapaneseJordanianKenyanKiowaKoreanLaotianLatvianLebaneseLiberianLithuanianLumbeeLuxembourgerMacedonianMalaysianMalteseMarshalleseMenomineeMexicanMexican American IndianMongolianMoroccanNative HawaiianNavajoNepaleseNew ZealanderNicaraguanNigerianNorthern EuropeanNorwegianOkinawanOsageOttawaPaiutePakistaniPalestinianPanamanianParaguayanPennsylvania GermanPeruvianPimaPolishPortuguesePotawatomiPuebloPuerto RicanPuget Sound SalishRomanianRussianSalvadoranSamoanScandinavianScotch-IrishScottishSeminoleSenegaleseSerbianShoshoneSierra LeoneanSiouxSlavicSlovakSloveneSomaliSouth AfricanSouth AmericanSouth American IndianSoviet UnionSpaniardSpanishSpanish AmericanSpanish American IndianSri LankanSubsaharan AfricanSudaneseSwedishSwissSyrianTaiwaneseThaiTlingit-HaidaTohono O'OdhamTonganTrinidadian and TobagonianTsimshianTurkishU.S. Virgin IslanderUgandanUkrainianUruguayanUteVenezuelanVietnameseWelshWest IndianYakamaYaquiYugoslavianYumanYup'ikZimbabwean
Immigration
NonimmigrantsImmigrantsAfghanistanAfricaAlbaniaArgentinaArmeniaAsiaAustraliaAustriaBahamasBangladeshBarbadosBelarusBelgiumBelizeBoliviaBosnia and HerzegovinaBrazilBulgariaBurma/MyanmarCabo VerdeCambodiaCameroonCanadaCaribbeanCentral AmericaChileChinaColombiaCongoCosta RicaCroatiaCubaCzechoslovakiaDenmarkDominicaDominican RepublicEastern AfricaEastern AsiaEastern EuropeEcuadorEgyptEl SalvadorEnglandEritreaEthiopiaEuropeFijiFranceGermanyGhanaGreeceGrenadaGuatemalaGuyanaHaitiHondurasHong KongHungaryIndiaIndonesiaIranIraqIrelandIsraelItalyJamaicaJapanJordanKazakhstanKenyaKoreaKuwaitLaosLatin AmericaLatviaLebanonLiberiaLithuaniaMalaysiaMexicoMicronesiaMiddle AfricaMoldovaMoroccoNepalNetherlandsNicaraguaNigeriaNorth AmericaNorth MacedoniaNorthern AfricaNorthern EuropeNorwayPakistanPanamaPeruPhilippinesPolandPortugalRomaniaRussiaSaudi ArabiaScotlandSenegalSerbiaSierra LeoneSingaporeSomaliaSouth AfricaSouth AmericaSouth Central AsiaSouth Eastern AsiaSouthern EuropeSpainSri LankaSt. Vincent and the GrenadinesSudanSwedenSwitzerlandSyriaTaiwanThailandTrinidad and TobagoTurkeyUgandaUkraineUruguayUzbekistanVenezuelaVietnamWest IndiesWestern AfricaWestern AsiaWestern EuropeYemenZaireZimbabweAzores
Immigrants from Oceania
Race
Ancestry
AfghanAfricanAlaska NativeAlaskan AthabascanAlbanianAleutAlsatianAmericanApacheArabArapahoArgentineanArmenianAssyrian/Chaldean/SyriacAustralianAustrianBahamianBangladeshiBarbadianBasqueBelgianBelizeanBermudanBhutaneseBlackfeetBolivianBrazilianBritishBritish West IndianBulgarianBurmeseCajunCambodianCanadianCape VerdeanCarpatho RusynCelticCentral AmericanCentral American IndianCherokeeCheyenneChickasawChileanChineseChippewaChoctawColombianColvilleComancheCosta RicanCreeCreekCroatianCrowCubanCypriotCzechCzechoslovakianDanishDelawareDominicanDutchDutch West IndianEastern EuropeanEcuadorianEgyptianEnglishEstonianEthiopianEuropeanFijianFilipinoFinnishFrenchFrench American IndianFrench CanadianGermanGerman RussianGhanaianGreekGuamanian/ChamorroGuatemalanGuyaneseHaitianHmongHonduranHopiHoumaHungarianIcelanderIndian (Asian)IndonesianInupiatIranianIraqiIrishIroquoisIsraeliItalianJamaicanJapaneseJordanianKenyanKiowaKoreanLaotianLatvianLebaneseLiberianLithuanianLumbeeLuxembourgerMacedonianMalaysianMalteseMarshalleseMenomineeMexicanMexican American IndianMongolianMoroccanNative HawaiianNavajoNepaleseNew ZealanderNicaraguanNigerianNorthern EuropeanNorwegianOkinawanOsageOttawaPaiutePakistaniPalestinianPanamanianParaguayanPennsylvania GermanPeruvianPimaPolishPortuguesePotawatomiPuebloPuerto RicanPuget Sound SalishRomanianRussianSalvadoranSamoanScandinavianScotch-IrishScottishSeminoleSenegaleseSerbianShoshoneSierra LeoneanSiouxSlavicSlovakSloveneSomaliSouth AfricanSouth AmericanSouth American IndianSoviet UnionSpaniardSpanishSpanish AmericanSpanish American IndianSri LankanSubsaharan AfricanSudaneseSwedishSwissSyrianTaiwaneseThaiTlingit-HaidaTohono O'OdhamTonganTrinidadian and TobagonianTsimshianTurkishU.S. Virgin IslanderUgandanUkrainianUruguayanUteVenezuelanVietnameseWelshWest IndianYakamaYaquiYugoslavianYumanYup'ikZimbabwean
Immigration
NonimmigrantsImmigrantsAfricaAlbaniaArgentinaArmeniaAsiaAustraliaAustriaBahamasBangladeshBarbadosBelarusBelgiumBelizeBoliviaBosnia and HerzegovinaBrazilBulgariaBurma/MyanmarCabo VerdeCambodiaCameroonCanadaCaribbeanCentral AmericaChileChinaColombiaCongoCosta RicaCroatiaCubaCzechoslovakiaDenmarkDominicaDominican RepublicEastern AfricaEastern AsiaEastern EuropeEcuadorEgyptEl SalvadorEnglandEritreaEthiopiaEuropeFijiFranceGermanyGhanaGreeceGrenadaGuatemalaGuyanaHaitiHondurasHong KongHungaryIndiaIndonesiaIranIraqIrelandIsraelItalyJamaicaJapanJordanKazakhstanKenyaKoreaKuwaitLaosLatin AmericaLatviaLebanonLiberiaLithuaniaMalaysiaMexicoMicronesiaMiddle AfricaMoldovaMoroccoNepalNetherlandsNicaraguaNigeriaNorth AmericaNorth MacedoniaNorthern AfricaNorthern EuropeNorwayOceaniaPakistanPanamaPeruPhilippinesPolandPortugalRomaniaRussiaSaudi ArabiaScotlandSenegalSerbiaSierra LeoneSingaporeSomaliaSouth AfricaSouth AmericaSouth Central AsiaSouth Eastern AsiaSouthern EuropeSpainSri LankaSt. Vincent and the GrenadinesSudanSwedenSwitzerlandSyriaTaiwanThailandTrinidad and TobagoTurkeyUgandaUkraineUruguayUzbekistanVenezuelaVietnamWest IndiesWestern AfricaWestern AsiaWestern EuropeYemenZaireZimbabweAzores
Disability Age 65 to 74
Income
Poverty
Unemployment
Labor Participation
Family Structure
Vehicle Availability
Education Level
Disability

Disability Age 65 to 74 Comparison

Immigrants from Afghanistan

Immigrants from Oceania

Good
Poor
23.2%
DISABILITY AGE 65 TO 74
60.5/ 100
METRIC RATING
166th/ 347
METRIC RANK
24.0%
DISABILITY AGE 65 TO 74
13.6/ 100
METRIC RATING
214th/ 347
METRIC RANK

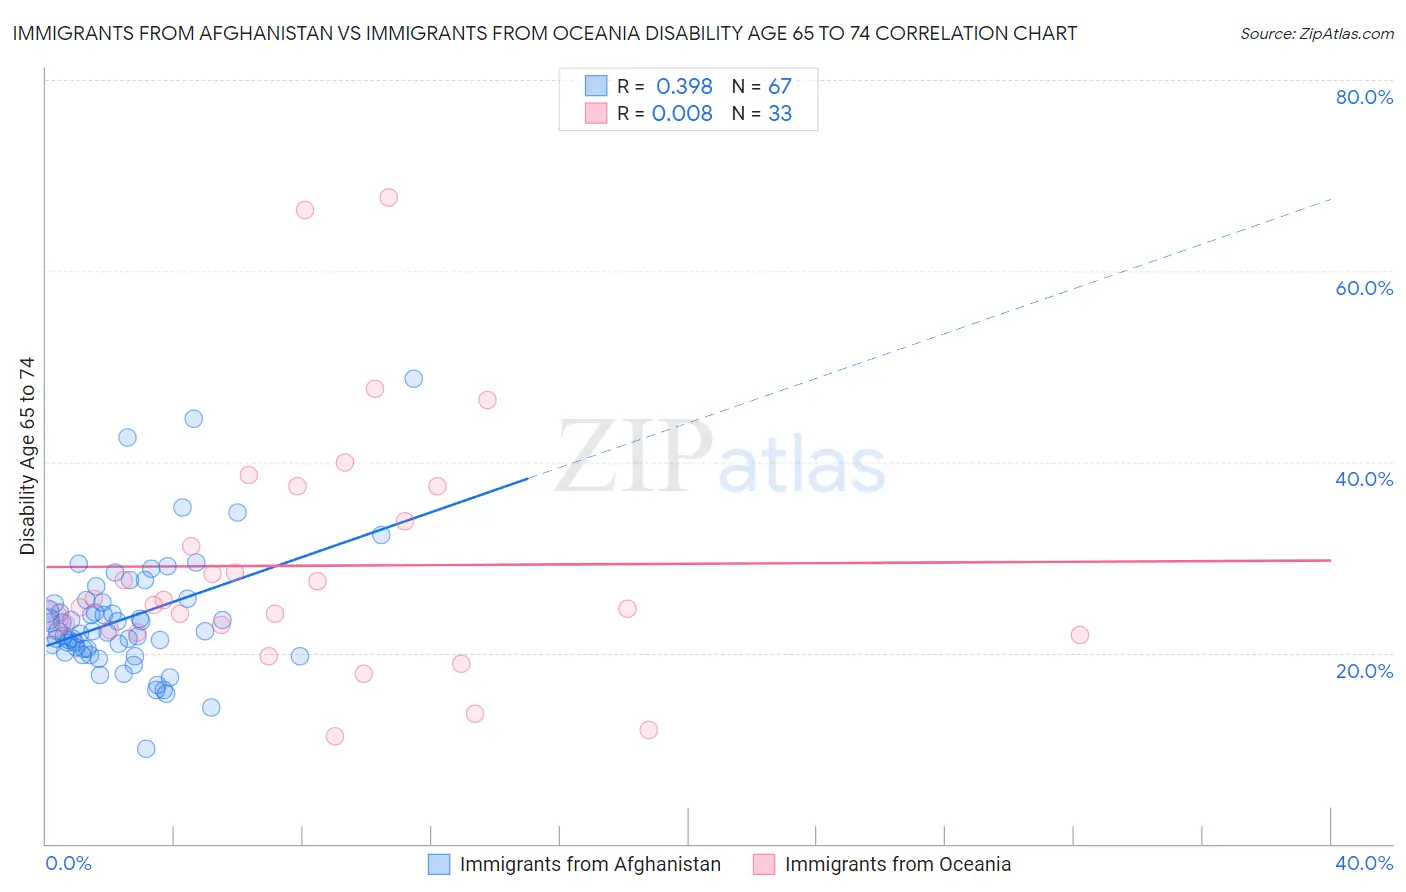
Immigrants from Afghanistan vs Immigrants from Oceania Disability Age 65 to 74 Correlation Chart

The statistical analysis conducted on geographies consisting of 147,591,650 people shows a mild positive correlation between the proportion of Immigrants from Afghanistan and percentage of population with a disability between the ages 65 and 75 in the United States with a correlation coefficient (R) of 0.398 and weighted average of 23.2%. Similarly, the statistical analysis conducted on geographies consisting of 304,918,832 people shows no correlation between the proportion of Immigrants from Oceania and percentage of population with a disability between the ages 65 and 75 in the United States with a correlation coefficient (R) of 0.008 and weighted average of 24.0%, a difference of 3.3%.
Immigrants from Afghanistan vs Immigrants from Oceania Disability Age 65 to 74

Disability Age 65 to 74 Correlation Summary

MeasurementImmigrants from AfghanistanImmigrants from Oceania
Minimum10.0%11.3%
Maximum48.7%67.7%
Range38.7%56.4%
Mean23.6%29.1%
Median22.3%25.1%
Interquartile 25% (IQ1)20.4%22.2%
Interquartile 75% (IQ3)25.3%35.6%
Interquartile Range (IQR)4.9%13.3%
Standard Deviation (Sample)6.5%13.1%
Standard Deviation (Population)6.4%12.9%

Similar Demographics by Disability Age 65 to 74

Demographics Similar to Immigrants from Afghanistan by Disability Age 65 to 74

In terms of disability age 65 to 74, the demographic groups most similar to Immigrants from Afghanistan are Sierra Leonean (23.2%, a difference of 0.020%), Vietnamese (23.2%, a difference of 0.020%), European (23.2%, a difference of 0.040%), Immigrants from Philippines (23.2%, a difference of 0.040%), and Immigrants from Bosnia and Herzegovina (23.2%, a difference of 0.18%).
DemographicsRating | RankDisability Age 65 to 74
South American Indians
65.5
/100
|
#159
Good
23.1%
Koreans
64.2
/100
|
#160
Good
23.1%
Immigrants | Cameroon
63.8
/100
|
#161
Good
23.1%
Europeans
61.2
/100
|
#162
Good
23.2%
Immigrants | Philippines
61.1
/100
|
#163
Good
23.2%
Sierra Leoneans
60.9
/100
|
#164
Good
23.2%
Vietnamese
60.8
/100
|
#165
Good
23.2%
Immigrants | Afghanistan
60.5
/100
|
#166
Good
23.2%
Immigrants | Bosnia and Herzegovina
57.6
/100
|
#167
Average
23.2%
Pakistanis
57.0
/100
|
#168
Average
23.2%
Icelanders
54.3
/100
|
#169
Average
23.3%
Moroccans
54.2
/100
|
#170
Average
23.3%
Cubans
51.9
/100
|
#171
Average
23.3%
Germans
50.5
/100
|
#172
Average
23.3%
Yugoslavians
50.2
/100
|
#173
Average
23.3%

Demographics Similar to Immigrants from Oceania by Disability Age 65 to 74

In terms of disability age 65 to 74, the demographic groups most similar to Immigrants from Oceania are Pennsylvania German (24.0%, a difference of 0.040%), Nicaraguan (23.9%, a difference of 0.080%), Jamaican (24.0%, a difference of 0.18%), French (23.9%, a difference of 0.24%), and Immigrants from Portugal (24.0%, a difference of 0.24%).
DemographicsRating | RankDisability Age 65 to 74
Immigrants | Sudan
20.1
/100
|
#207
Fair
23.8%
Immigrants | Barbados
19.6
/100
|
#208
Poor
23.8%
Immigrants | Kenya
19.6
/100
|
#209
Poor
23.8%
Trinidadians and Tobagonians
16.4
/100
|
#210
Poor
23.9%
Immigrants | West Indies
15.9
/100
|
#211
Poor
23.9%
French
15.7
/100
|
#212
Poor
23.9%
Nicaraguans
14.3
/100
|
#213
Poor
23.9%
Immigrants | Oceania
13.6
/100
|
#214
Poor
24.0%
Pennsylvania Germans
13.3
/100
|
#215
Poor
24.0%
Jamaicans
12.2
/100
|
#216
Poor
24.0%
Immigrants | Portugal
11.7
/100
|
#217
Poor
24.0%
Immigrants | Nigeria
11.7
/100
|
#218
Poor
24.0%
Immigrants | Burma/Myanmar
11.6
/100
|
#219
Poor
24.0%
Ghanaians
10.4
/100
|
#220
Poor
24.1%
Immigrants | Nicaragua
9.8
/100
|
#221
Tragic
24.1%