Icelander vs Swiss Disability Age 65 to 74
COMPARE
Icelander
Swiss
Disability Age 65 to 74
Disability Age 65 to 74 Comparison
Icelanders
Swiss
23.3%
DISABILITY AGE 65 TO 74
54.3/ 100
METRIC RATING
169th/ 347
METRIC RANK
22.9%
DISABILITY AGE 65 TO 74
79.7/ 100
METRIC RATING
149th/ 347
METRIC RANK
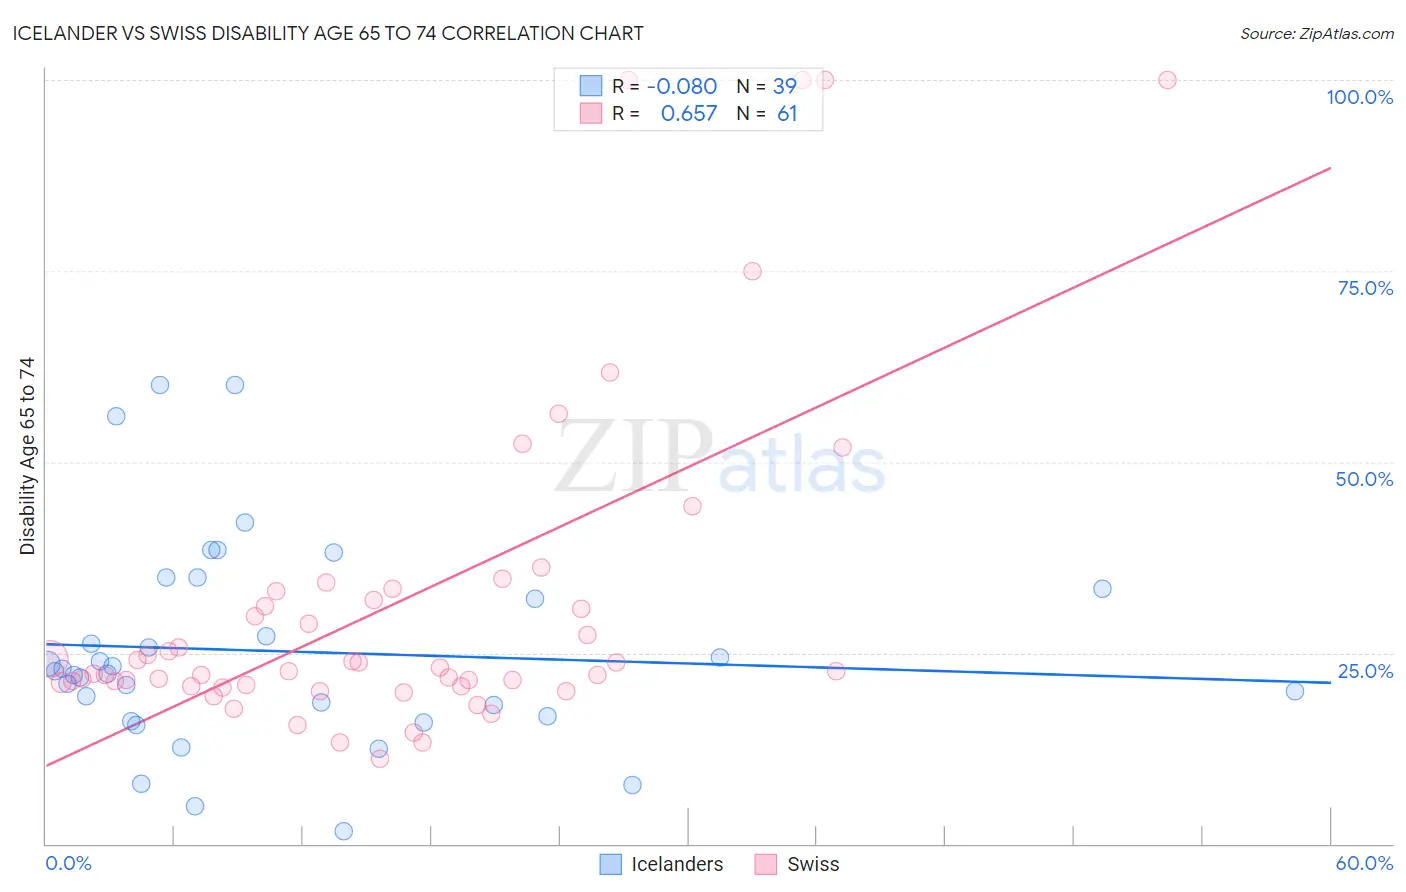
Icelander vs Swiss Disability Age 65 to 74 Correlation Chart
The statistical analysis conducted on geographies consisting of 159,581,856 people shows a slight negative correlation between the proportion of Icelanders and percentage of population with a disability between the ages 65 and 75 in the United States with a correlation coefficient (R) of -0.080 and weighted average of 23.3%. Similarly, the statistical analysis conducted on geographies consisting of 464,066,686 people shows a significant positive correlation between the proportion of Swiss and percentage of population with a disability between the ages 65 and 75 in the United States with a correlation coefficient (R) of 0.657 and weighted average of 22.9%, a difference of 1.8%.
Disability Age 65 to 74 Correlation Summary
| Measurement | Icelander | Swiss |
| Minimum | 1.7% | 11.1% |
| Maximum | 60.0% | 100.0% |
| Range | 58.3% | 88.9% |
| Mean | 25.2% | 31.5% |
| Median | 22.6% | 22.6% |
| Interquartile 25% (IQ1) | 16.7% | 20.7% |
| Interquartile 75% (IQ3) | 33.3% | 32.5% |
| Interquartile Range (IQR) | 16.7% | 11.8% |
| Standard Deviation (Sample) | 13.5% | 21.8% |
| Standard Deviation (Population) | 13.4% | 21.6% |
Demographics Similar to Icelanders and Swiss by Disability Age 65 to 74
In terms of disability age 65 to 74, the demographic groups most similar to Icelanders are Pakistani (23.2%, a difference of 0.16%), Immigrants from Bosnia and Herzegovina (23.2%, a difference of 0.20%), Immigrants from Afghanistan (23.2%, a difference of 0.37%), Vietnamese (23.2%, a difference of 0.39%), and Sierra Leonean (23.2%, a difference of 0.40%). Similarly, the demographic groups most similar to Swiss are Canadian (22.9%, a difference of 0.18%), Immigrants from Morocco (22.9%, a difference of 0.18%), Finnish (22.9%, a difference of 0.27%), Slavic (23.0%, a difference of 0.38%), and Sri Lankan (23.0%, a difference of 0.47%).
| Demographics | Rating | Rank | Disability Age 65 to 74 |
| Swiss | 79.7 /100 | #149 | Good 22.9% |
| Canadians | 77.7 /100 | #150 | Good 22.9% |
| Immigrants | Morocco | 77.6 /100 | #151 | Good 22.9% |
| Finns | 76.5 /100 | #152 | Good 22.9% |
| Slavs | 75.2 /100 | #153 | Good 23.0% |
| Sri Lankans | 74.0 /100 | #154 | Good 23.0% |
| British | 73.9 /100 | #155 | Good 23.0% |
| Immigrants | Western Asia | 73.8 /100 | #156 | Good 23.0% |
| Czechoslovakians | 72.4 /100 | #157 | Good 23.0% |
| Immigrants | Vietnam | 69.1 /100 | #158 | Good 23.1% |
| South American Indians | 65.5 /100 | #159 | Good 23.1% |
| Koreans | 64.2 /100 | #160 | Good 23.1% |
| Immigrants | Cameroon | 63.8 /100 | #161 | Good 23.1% |
| Europeans | 61.2 /100 | #162 | Good 23.2% |
| Immigrants | Philippines | 61.1 /100 | #163 | Good 23.2% |
| Sierra Leoneans | 60.9 /100 | #164 | Good 23.2% |
| Vietnamese | 60.8 /100 | #165 | Good 23.2% |
| Immigrants | Afghanistan | 60.5 /100 | #166 | Good 23.2% |
| Immigrants | Bosnia and Herzegovina | 57.6 /100 | #167 | Average 23.2% |
| Pakistanis | 57.0 /100 | #168 | Average 23.2% |
| Icelanders | 54.3 /100 | #169 | Average 23.3% |