Icelander vs Immigrants from Zaire Vision Disability
COMPARE
Icelander
Immigrants from Zaire
Vision Disability
Vision Disability Comparison
Icelanders
Immigrants from Zaire
2.1%
VISION DISABILITY
66.1/ 100
METRIC RATING
163rd/ 347
METRIC RANK
2.2%
VISION DISABILITY
18.0/ 100
METRIC RATING
202nd/ 347
METRIC RANK
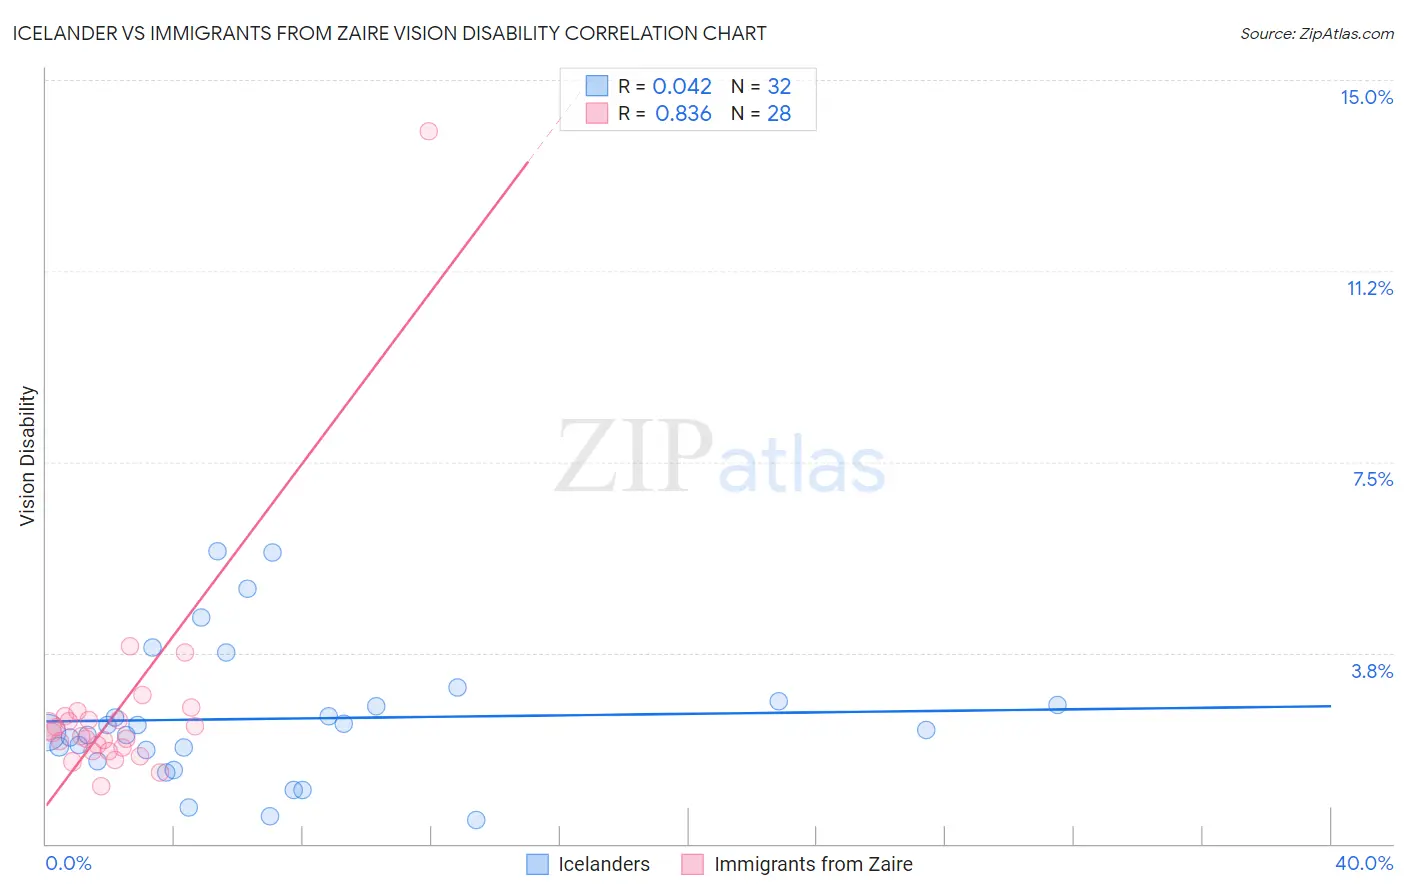
Icelander vs Immigrants from Zaire Vision Disability Correlation Chart
The statistical analysis conducted on geographies consisting of 159,612,613 people shows no correlation between the proportion of Icelanders and percentage of population with vision disability in the United States with a correlation coefficient (R) of 0.042 and weighted average of 2.1%. Similarly, the statistical analysis conducted on geographies consisting of 107,249,797 people shows a very strong positive correlation between the proportion of Immigrants from Zaire and percentage of population with vision disability in the United States with a correlation coefficient (R) of 0.836 and weighted average of 2.2%, a difference of 3.5%.
Vision Disability Correlation Summary
| Measurement | Icelander | Immigrants from Zaire |
| Minimum | 0.48% | 1.1% |
| Maximum | 5.7% | 14.0% |
| Range | 5.3% | 12.9% |
| Mean | 2.5% | 2.6% |
| Median | 2.2% | 2.1% |
| Interquartile 25% (IQ1) | 1.7% | 1.9% |
| Interquartile 75% (IQ3) | 2.8% | 2.5% |
| Interquartile Range (IQR) | 1.0% | 0.61% |
| Standard Deviation (Sample) | 1.3% | 2.3% |
| Standard Deviation (Population) | 1.3% | 2.3% |
Similar Demographics by Vision Disability
Demographics Similar to Icelanders by Vision Disability
In terms of vision disability, the demographic groups most similar to Icelanders are Immigrants from Bangladesh (2.1%, a difference of 0.040%), Hungarian (2.1%, a difference of 0.090%), Immigrants from Iraq (2.1%, a difference of 0.090%), Iraqi (2.1%, a difference of 0.12%), and Austrian (2.1%, a difference of 0.21%).
| Demographics | Rating | Rank | Vision Disability |
| Pakistanis | 71.6 /100 | #156 | Good 2.1% |
| Serbians | 70.2 /100 | #157 | Good 2.1% |
| Immigrants | Uzbekistan | 69.9 /100 | #158 | Good 2.1% |
| South Africans | 69.8 /100 | #159 | Good 2.1% |
| Austrians | 69.0 /100 | #160 | Good 2.1% |
| Iraqis | 67.7 /100 | #161 | Good 2.1% |
| Hungarians | 67.4 /100 | #162 | Good 2.1% |
| Icelanders | 66.1 /100 | #163 | Good 2.1% |
| Immigrants | Bangladesh | 65.5 /100 | #164 | Good 2.1% |
| Immigrants | Iraq | 64.8 /100 | #165 | Good 2.1% |
| Immigrants | England | 62.8 /100 | #166 | Good 2.1% |
| Immigrants | Africa | 62.6 /100 | #167 | Good 2.1% |
| Brazilians | 62.2 /100 | #168 | Good 2.1% |
| South American Indians | 57.4 /100 | #169 | Average 2.2% |
| Swiss | 55.7 /100 | #170 | Average 2.2% |
Demographics Similar to Immigrants from Zaire by Vision Disability
In terms of vision disability, the demographic groups most similar to Immigrants from Zaire are Slovak (2.2%, a difference of 0.090%), Dutch (2.2%, a difference of 0.10%), Immigrants from Thailand (2.2%, a difference of 0.22%), Immigrants from Guyana (2.2%, a difference of 0.23%), and Samoan (2.2%, a difference of 0.25%).
| Demographics | Rating | Rank | Vision Disability |
| Immigrants | Immigrants | 23.7 /100 | #195 | Fair 2.2% |
| Immigrants | Grenada | 23.1 /100 | #196 | Fair 2.2% |
| Ghanaians | 21.8 /100 | #197 | Fair 2.2% |
| Czechoslovakians | 21.6 /100 | #198 | Fair 2.2% |
| Immigrants | El Salvador | 21.0 /100 | #199 | Fair 2.2% |
| Immigrants | Thailand | 20.1 /100 | #200 | Fair 2.2% |
| Slovaks | 18.8 /100 | #201 | Poor 2.2% |
| Immigrants | Zaire | 18.0 /100 | #202 | Poor 2.2% |
| Dutch | 17.1 /100 | #203 | Poor 2.2% |
| Immigrants | Guyana | 15.9 /100 | #204 | Poor 2.2% |
| Samoans | 15.7 /100 | #205 | Poor 2.2% |
| Pennsylvania Germans | 14.5 /100 | #206 | Poor 2.2% |
| Immigrants | Nigeria | 13.5 /100 | #207 | Poor 2.2% |
| Germans | 13.4 /100 | #208 | Poor 2.2% |
| Immigrants | Brazil | 13.1 /100 | #209 | Poor 2.2% |