Hungarian vs Ottawa Disability Age 65 to 74

COMPARE

Hungarian
Race
Ancestry
AfghanAfricanAlaska NativeAlaskan AthabascanAlbanianAleutAlsatianAmericanApacheArabArapahoArgentineanArmenianAssyrian/Chaldean/SyriacAustralianAustrianBahamianBangladeshiBarbadianBasqueBelgianBelizeanBermudanBhutaneseBlackfeetBolivianBrazilianBritishBritish West IndianBulgarianBurmeseCajunCambodianCanadianCape VerdeanCarpatho RusynCelticCentral AmericanCentral American IndianCherokeeCheyenneChickasawChileanChineseChippewaChoctawColombianColvilleComancheCosta RicanCreeCreekCroatianCrowCubanCypriotCzechCzechoslovakianDanishDelawareDominicanDutchDutch West IndianEastern EuropeanEcuadorianEgyptianEnglishEstonianEthiopianEuropeanFijianFilipinoFinnishFrenchFrench American IndianFrench CanadianGermanGerman RussianGhanaianGreekGuamanian/ChamorroGuatemalanGuyaneseHaitianHmongHonduranHopiHoumaHungarianIcelanderIndian (Asian)IndonesianInupiatIranianIraqiIrishIroquoisIsraeliItalianJamaicanJapaneseJordanianKenyanKiowaKoreanLaotianLatvianLebaneseLiberianLithuanianLumbeeLuxembourgerMacedonianMalaysianMalteseMarshalleseMenomineeMexicanMexican American IndianMongolianMoroccanNative HawaiianNavajoNepaleseNew ZealanderNicaraguanNigerianNorthern EuropeanNorwegianOkinawanOsagePaiutePakistaniPalestinianPanamanianParaguayanPennsylvania GermanPeruvianPimaPolishPortuguesePotawatomiPuebloPuerto RicanPuget Sound SalishRomanianRussianSalvadoranSamoanScandinavianScotch-IrishScottishSeminoleSenegaleseSerbianShoshoneSierra LeoneanSiouxSlavicSlovakSloveneSomaliSouth AfricanSouth AmericanSouth American IndianSoviet UnionSpaniardSpanishSpanish AmericanSpanish American IndianSri LankanSubsaharan AfricanSudaneseSwedishSwissSyrianTaiwaneseThaiTlingit-HaidaTohono O'OdhamTonganTrinidadian and TobagonianTsimshianTurkishU.S. Virgin IslanderUgandanUkrainianUruguayanUteVenezuelanVietnameseWelshWest IndianYakamaYaquiYugoslavianYumanYup'ikZimbabwean
Immigration
NonimmigrantsImmigrantsAfghanistanAfricaAlbaniaArgentinaArmeniaAsiaAustraliaAustriaBahamasBangladeshBarbadosBelarusBelgiumBelizeBoliviaBosnia and HerzegovinaBrazilBulgariaBurma/MyanmarCabo VerdeCambodiaCameroonCanadaCaribbeanCentral AmericaChileChinaColombiaCongoCosta RicaCroatiaCubaCzechoslovakiaDenmarkDominicaDominican RepublicEastern AfricaEastern AsiaEastern EuropeEcuadorEgyptEl SalvadorEnglandEritreaEthiopiaEuropeFijiFranceGermanyGhanaGreeceGrenadaGuatemalaGuyanaHaitiHondurasHong KongHungaryIndiaIndonesiaIranIraqIrelandIsraelItalyJamaicaJapanJordanKazakhstanKenyaKoreaKuwaitLaosLatin AmericaLatviaLebanonLiberiaLithuaniaMalaysiaMexicoMicronesiaMiddle AfricaMoldovaMoroccoNepalNetherlandsNicaraguaNigeriaNorth AmericaNorth MacedoniaNorthern AfricaNorthern EuropeNorwayOceaniaPakistanPanamaPeruPhilippinesPolandPortugalRomaniaRussiaSaudi ArabiaScotlandSenegalSerbiaSierra LeoneSingaporeSomaliaSouth AfricaSouth AmericaSouth Central AsiaSouth Eastern AsiaSouthern EuropeSpainSri LankaSt. Vincent and the GrenadinesSudanSwedenSwitzerlandSyriaTaiwanThailandTrinidad and TobagoTurkeyUgandaUkraineUruguayUzbekistanVenezuelaVietnamWest IndiesWestern AfricaWestern AsiaWestern EuropeYemenZaireZimbabweAzores
Ottawa
Race
Ancestry
AfghanAfricanAlaska NativeAlaskan AthabascanAlbanianAleutAlsatianAmericanApacheArabArapahoArgentineanArmenianAssyrian/Chaldean/SyriacAustralianAustrianBahamianBangladeshiBarbadianBasqueBelgianBelizeanBermudanBhutaneseBlackfeetBolivianBrazilianBritishBritish West IndianBulgarianBurmeseCajunCambodianCanadianCape VerdeanCarpatho RusynCelticCentral AmericanCentral American IndianCherokeeCheyenneChickasawChileanChineseChippewaChoctawColombianColvilleComancheCosta RicanCreeCreekCroatianCrowCubanCypriotCzechCzechoslovakianDanishDelawareDominicanDutchDutch West IndianEastern EuropeanEcuadorianEgyptianEnglishEstonianEthiopianEuropeanFijianFilipinoFinnishFrenchFrench American IndianFrench CanadianGermanGerman RussianGhanaianGreekGuamanian/ChamorroGuatemalanGuyaneseHaitianHmongHonduranHopiHoumaIcelanderIndian (Asian)IndonesianInupiatIranianIraqiIrishIroquoisIsraeliItalianJamaicanJapaneseJordanianKenyanKiowaKoreanLaotianLatvianLebaneseLiberianLithuanianLumbeeLuxembourgerMacedonianMalaysianMalteseMarshalleseMenomineeMexicanMexican American IndianMongolianMoroccanNative HawaiianNavajoNepaleseNew ZealanderNicaraguanNigerianNorthern EuropeanNorwegianOkinawanOsageOttawaPaiutePakistaniPalestinianPanamanianParaguayanPennsylvania GermanPeruvianPimaPolishPortuguesePotawatomiPuebloPuerto RicanPuget Sound SalishRomanianRussianSalvadoranSamoanScandinavianScotch-IrishScottishSeminoleSenegaleseSerbianShoshoneSierra LeoneanSiouxSlavicSlovakSloveneSomaliSouth AfricanSouth AmericanSouth American IndianSoviet UnionSpaniardSpanishSpanish AmericanSpanish American IndianSri LankanSubsaharan AfricanSudaneseSwedishSwissSyrianTaiwaneseThaiTlingit-HaidaTohono O'OdhamTonganTrinidadian and TobagonianTsimshianTurkishU.S. Virgin IslanderUgandanUkrainianUruguayanUteVenezuelanVietnameseWelshWest IndianYakamaYaquiYugoslavianYumanYup'ikZimbabwean
Immigration
NonimmigrantsImmigrantsAfghanistanAfricaAlbaniaArgentinaArmeniaAsiaAustraliaAustriaBahamasBangladeshBarbadosBelarusBelgiumBelizeBoliviaBosnia and HerzegovinaBrazilBulgariaBurma/MyanmarCabo VerdeCambodiaCameroonCanadaCaribbeanCentral AmericaChileChinaColombiaCongoCosta RicaCroatiaCubaCzechoslovakiaDenmarkDominicaDominican RepublicEastern AfricaEastern AsiaEastern EuropeEcuadorEgyptEl SalvadorEnglandEritreaEthiopiaEuropeFijiFranceGermanyGhanaGreeceGrenadaGuatemalaGuyanaHaitiHondurasHong KongHungaryIndiaIndonesiaIranIraqIrelandIsraelItalyJamaicaJapanJordanKazakhstanKenyaKoreaKuwaitLaosLatin AmericaLatviaLebanonLiberiaLithuaniaMalaysiaMexicoMicronesiaMiddle AfricaMoldovaMoroccoNepalNetherlandsNicaraguaNigeriaNorth AmericaNorth MacedoniaNorthern AfricaNorthern EuropeNorwayOceaniaPakistanPanamaPeruPhilippinesPolandPortugalRomaniaRussiaSaudi ArabiaScotlandSenegalSerbiaSierra LeoneSingaporeSomaliaSouth AfricaSouth AmericaSouth Central AsiaSouth Eastern AsiaSouthern EuropeSpainSri LankaSt. Vincent and the GrenadinesSudanSwedenSwitzerlandSyriaTaiwanThailandTrinidad and TobagoTurkeyUgandaUkraineUruguayUzbekistanVenezuelaVietnamWest IndiesWestern AfricaWestern AsiaWestern EuropeYemenZaireZimbabweAzores
Disability Age 65 to 74
Income
Poverty
Unemployment
Labor Participation
Family Structure
Vehicle Availability
Education Level
Disability

Disability Age 65 to 74 Comparison

Hungarians

Ottawa

Exceptional
Tragic
22.4%
DISABILITY AGE 65 TO 74
93.3/ 100
METRIC RATING
123rd/ 347
METRIC RANK
25.6%
DISABILITY AGE 65 TO 74
0.1/ 100
METRIC RATING
267th/ 347
METRIC RANK

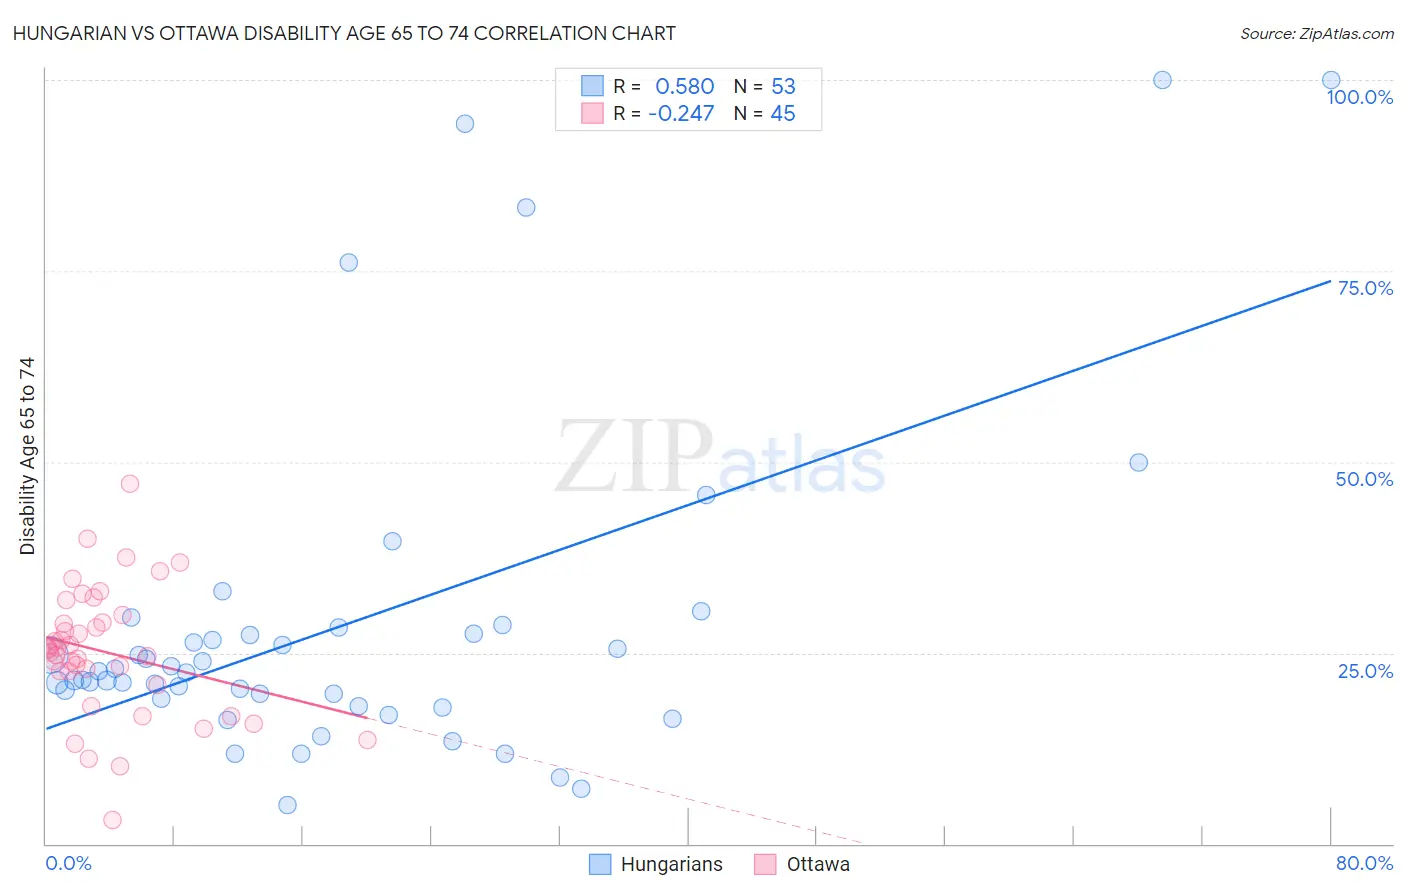
Hungarian vs Ottawa Disability Age 65 to 74 Correlation Chart

The statistical analysis conducted on geographies consisting of 484,991,296 people shows a substantial positive correlation between the proportion of Hungarians and percentage of population with a disability between the ages 65 and 75 in the United States with a correlation coefficient (R) of 0.580 and weighted average of 22.4%. Similarly, the statistical analysis conducted on geographies consisting of 49,922,669 people shows a weak negative correlation between the proportion of Ottawa and percentage of population with a disability between the ages 65 and 75 in the United States with a correlation coefficient (R) of -0.247 and weighted average of 25.6%, a difference of 14.1%.
Hungarian vs Ottawa Disability Age 65 to 74

Disability Age 65 to 74 Correlation Summary

MeasurementHungarianOttawa
Minimum5.1%3.0%
Maximum100.0%47.1%
Range94.9%44.0%
Mean28.7%25.1%
Median22.4%25.5%
Interquartile 25% (IQ1)18.5%21.6%
Interquartile 75% (IQ3)27.9%29.5%
Interquartile Range (IQR)9.3%7.9%
Standard Deviation (Sample)22.0%8.4%
Standard Deviation (Population)21.8%8.3%

Similar Demographics by Disability Age 65 to 74

Demographics Similar to Hungarians by Disability Age 65 to 74

In terms of disability age 65 to 74, the demographic groups most similar to Hungarians are Czech (22.4%, a difference of 0.050%), Immigrants from Jordan (22.4%, a difference of 0.050%), Immigrants from Kazakhstan (22.4%, a difference of 0.15%), Norwegian (22.5%, a difference of 0.19%), and Immigrants from Western Europe (22.5%, a difference of 0.23%).
DemographicsRating | RankDisability Age 65 to 74
Brazilians
94.8
/100
|
#116
Exceptional
22.4%
Swedes
94.7
/100
|
#117
Exceptional
22.4%
Austrians
94.7
/100
|
#118
Exceptional
22.4%
Immigrants | Northern Africa
94.7
/100
|
#119
Exceptional
22.4%
Immigrants | Kazakhstan
93.9
/100
|
#120
Exceptional
22.4%
Czechs
93.5
/100
|
#121
Exceptional
22.4%
Immigrants | Jordan
93.5
/100
|
#122
Exceptional
22.4%
Hungarians
93.3
/100
|
#123
Exceptional
22.4%
Norwegians
92.5
/100
|
#124
Exceptional
22.5%
Immigrants | Western Europe
92.3
/100
|
#125
Exceptional
22.5%
Lebanese
92.2
/100
|
#126
Exceptional
22.5%
Slovaks
91.6
/100
|
#127
Exceptional
22.5%
Immigrants | Costa Rica
90.4
/100
|
#128
Exceptional
22.6%
Immigrants | Uruguay
90.1
/100
|
#129
Exceptional
22.6%
Immigrants | Albania
90.0
/100
|
#130
Excellent
22.6%

Demographics Similar to Ottawa by Disability Age 65 to 74

In terms of disability age 65 to 74, the demographic groups most similar to Ottawa are Liberian (25.6%, a difference of 0.10%), Immigrants from Latin America (25.6%, a difference of 0.14%), Hmong (25.7%, a difference of 0.22%), Guatemalan (25.5%, a difference of 0.23%), and Hawaiian (25.5%, a difference of 0.27%).
DemographicsRating | RankDisability Age 65 to 74
Malaysians
0.2
/100
|
#260
Tragic
25.4%
Cape Verdeans
0.2
/100
|
#261
Tragic
25.4%
Samoans
0.2
/100
|
#262
Tragic
25.4%
Iroquois
0.2
/100
|
#263
Tragic
25.4%
Hawaiians
0.2
/100
|
#264
Tragic
25.5%
Guatemalans
0.2
/100
|
#265
Tragic
25.5%
Immigrants | Latin America
0.1
/100
|
#266
Tragic
25.6%
Ottawa
0.1
/100
|
#267
Tragic
25.6%
Liberians
0.1
/100
|
#268
Tragic
25.6%
Hmong
0.1
/100
|
#269
Tragic
25.7%
Immigrants | Guatemala
0.1
/100
|
#270
Tragic
25.7%
Immigrants | Liberia
0.1
/100
|
#271
Tragic
25.7%
Immigrants | Dominica
0.1
/100
|
#272
Tragic
25.7%
Japanese
0.1
/100
|
#273
Tragic
25.7%
Americans
0.1
/100
|
#274
Tragic
25.8%