Hopi vs Serbian Disability Age 65 to 74
COMPARE
Hopi
Serbian
Disability Age 65 to 74
Disability Age 65 to 74 Comparison
Hopi
Serbians
30.0%
DISABILITY AGE 65 TO 74
0.0/ 100
METRIC RATING
328th/ 347
METRIC RANK
22.3%
DISABILITY AGE 65 TO 74
95.7/ 100
METRIC RATING
111th/ 347
METRIC RANK
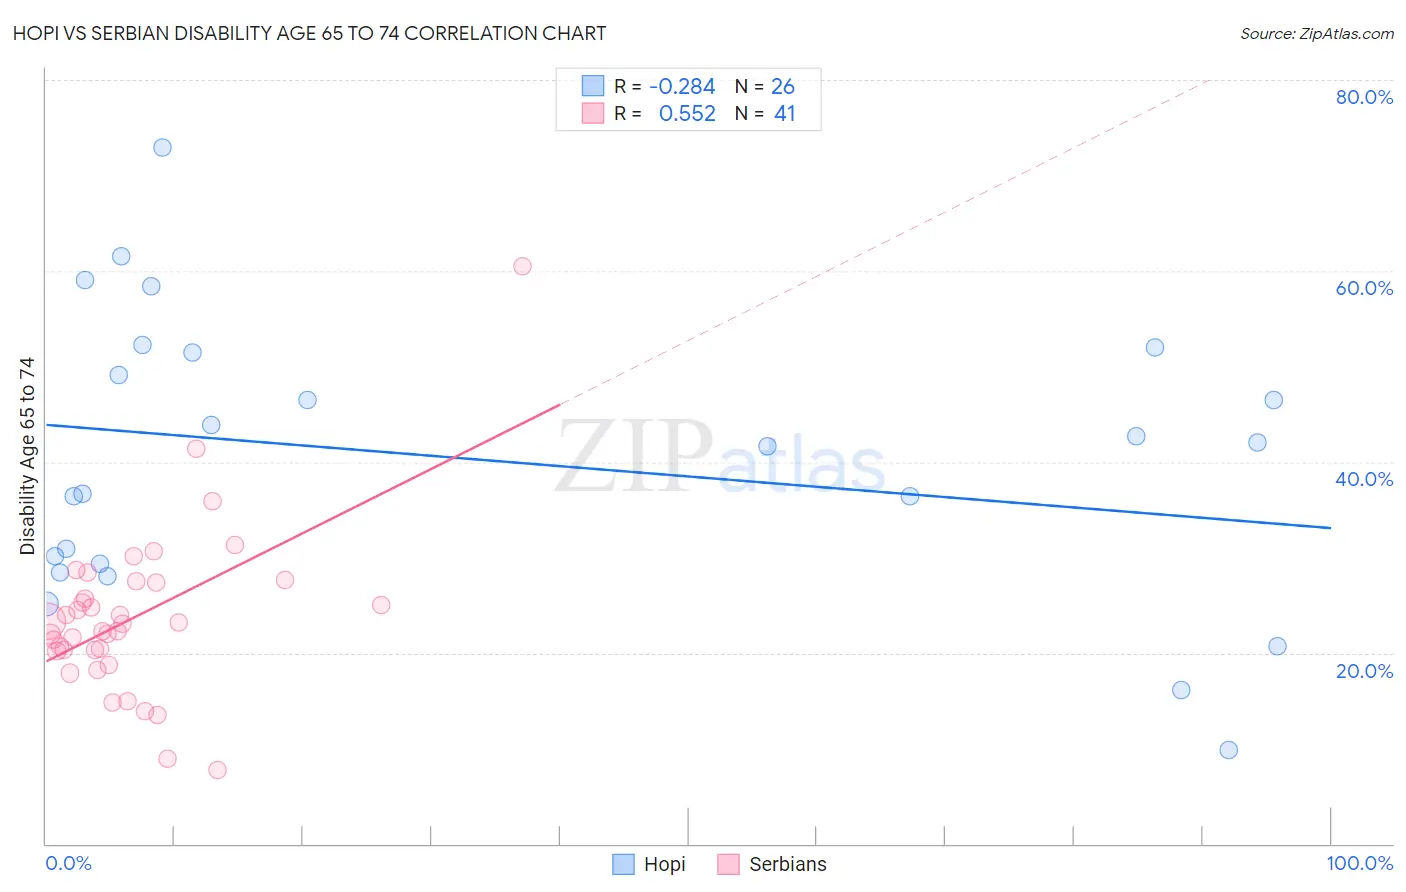
Hopi vs Serbian Disability Age 65 to 74 Correlation Chart
The statistical analysis conducted on geographies consisting of 74,641,901 people shows a weak negative correlation between the proportion of Hopi and percentage of population with a disability between the ages 65 and 75 in the United States with a correlation coefficient (R) of -0.284 and weighted average of 30.0%. Similarly, the statistical analysis conducted on geographies consisting of 267,379,392 people shows a substantial positive correlation between the proportion of Serbians and percentage of population with a disability between the ages 65 and 75 in the United States with a correlation coefficient (R) of 0.552 and weighted average of 22.3%, a difference of 34.4%.
Disability Age 65 to 74 Correlation Summary
| Measurement | Hopi | Serbian |
| Minimum | 9.9% | 7.7% |
| Maximum | 72.9% | 60.4% |
| Range | 63.1% | 52.8% |
| Mean | 40.3% | 23.7% |
| Median | 41.8% | 23.1% |
| Interquartile 25% (IQ1) | 29.4% | 20.2% |
| Interquartile 75% (IQ3) | 51.5% | 27.4% |
| Interquartile Range (IQR) | 22.1% | 7.2% |
| Standard Deviation (Sample) | 14.9% | 8.7% |
| Standard Deviation (Population) | 14.6% | 8.6% |
Similar Demographics by Disability Age 65 to 74
Demographics Similar to Hopi by Disability Age 65 to 74
In terms of disability age 65 to 74, the demographic groups most similar to Hopi are Choctaw (30.2%, a difference of 0.80%), Creek (30.2%, a difference of 0.83%), Chickasaw (30.2%, a difference of 0.84%), Apache (29.7%, a difference of 0.94%), and Yakama (29.6%, a difference of 1.1%).
| Demographics | Rating | Rank | Disability Age 65 to 74 |
| Comanche | 0.0 /100 | #321 | Tragic 28.3% |
| Aleuts | 0.0 /100 | #322 | Tragic 28.4% |
| Puerto Ricans | 0.0 /100 | #323 | Tragic 29.1% |
| Seminole | 0.0 /100 | #324 | Tragic 29.4% |
| Dutch West Indians | 0.0 /100 | #325 | Tragic 29.6% |
| Yakama | 0.0 /100 | #326 | Tragic 29.6% |
| Apache | 0.0 /100 | #327 | Tragic 29.7% |
| Hopi | 0.0 /100 | #328 | Tragic 30.0% |
| Choctaw | 0.0 /100 | #329 | Tragic 30.2% |
| Creek | 0.0 /100 | #330 | Tragic 30.2% |
| Chickasaw | 0.0 /100 | #331 | Tragic 30.2% |
| Natives/Alaskans | 0.0 /100 | #332 | Tragic 30.4% |
| Colville | 0.0 /100 | #333 | Tragic 30.5% |
| Alaska Natives | 0.0 /100 | #334 | Tragic 30.6% |
| Cheyenne | 0.0 /100 | #335 | Tragic 31.1% |
Demographics Similar to Serbians by Disability Age 65 to 74
In terms of disability age 65 to 74, the demographic groups most similar to Serbians are Immigrants from Peru (22.3%, a difference of 0.020%), Immigrants from South America (22.3%, a difference of 0.060%), Albanian (22.3%, a difference of 0.070%), Syrian (22.3%, a difference of 0.11%), and Immigrants from Zimbabwe (22.3%, a difference of 0.16%).
| Demographics | Rating | Rank | Disability Age 65 to 74 |
| Colombians | 96.4 /100 | #104 | Exceptional 22.2% |
| Palestinians | 96.3 /100 | #105 | Exceptional 22.2% |
| Peruvians | 96.1 /100 | #106 | Exceptional 22.2% |
| Slovenes | 96.1 /100 | #107 | Exceptional 22.2% |
| Immigrants | Zimbabwe | 96.1 /100 | #108 | Exceptional 22.3% |
| Albanians | 95.8 /100 | #109 | Exceptional 22.3% |
| Immigrants | Peru | 95.7 /100 | #110 | Exceptional 22.3% |
| Serbians | 95.7 /100 | #111 | Exceptional 22.3% |
| Immigrants | South America | 95.5 /100 | #112 | Exceptional 22.3% |
| Syrians | 95.3 /100 | #113 | Exceptional 22.3% |
| Ukrainians | 95.1 /100 | #114 | Exceptional 22.3% |
| Laotians | 94.9 /100 | #115 | Exceptional 22.3% |
| Brazilians | 94.8 /100 | #116 | Exceptional 22.4% |
| Swedes | 94.7 /100 | #117 | Exceptional 22.4% |
| Austrians | 94.7 /100 | #118 | Exceptional 22.4% |