Honduran vs Guyanese Vision Disability
COMPARE
Honduran
Guyanese
Vision Disability
Vision Disability Comparison
Hondurans
Guyanese
2.5%
VISION DISABILITY
0.0/ 100
METRIC RATING
287th/ 347
METRIC RANK
2.2%
VISION DISABILITY
28.9/ 100
METRIC RATING
188th/ 347
METRIC RANK
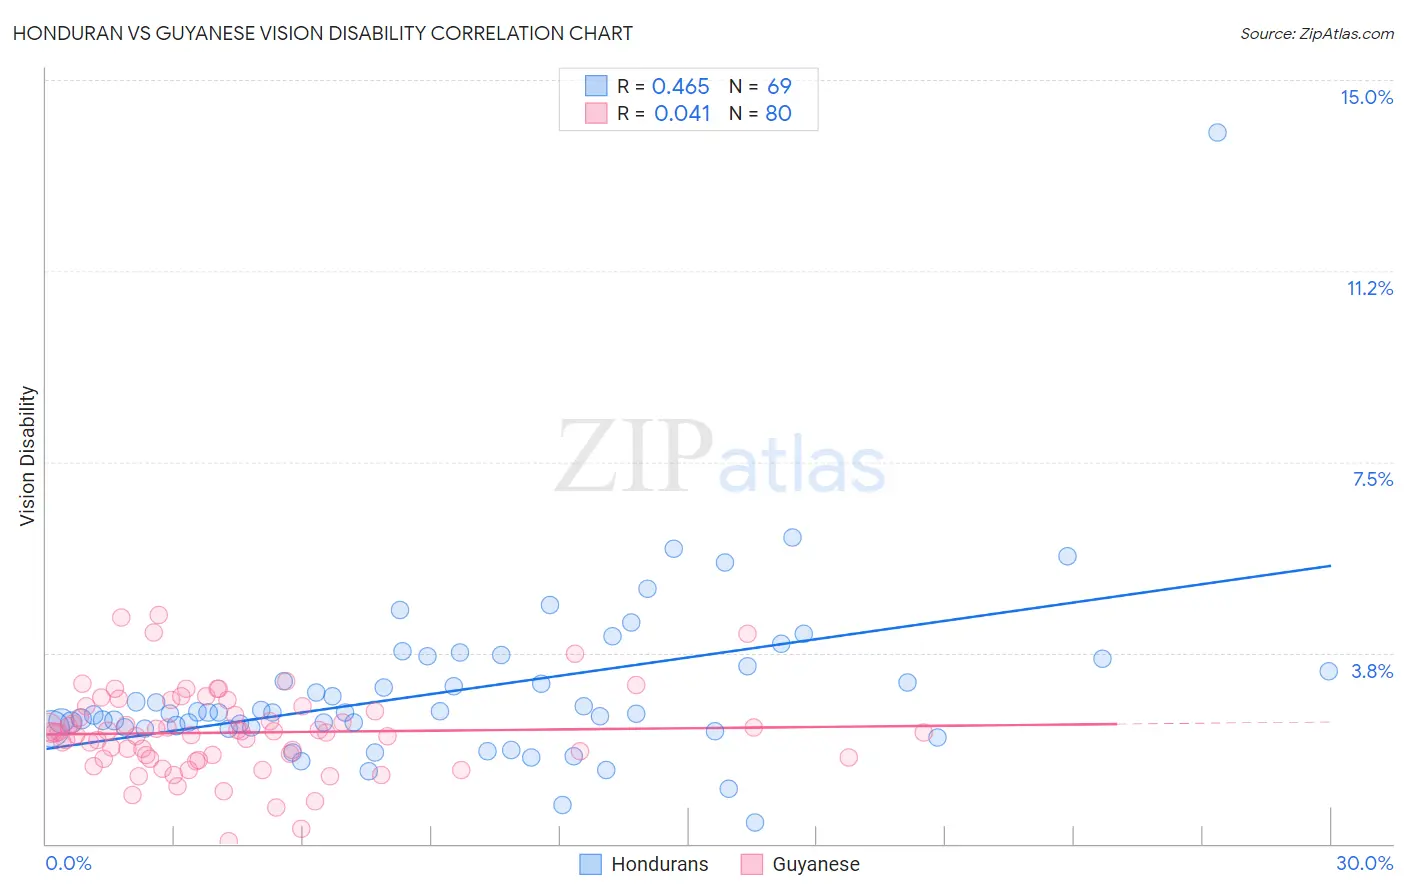
Honduran vs Guyanese Vision Disability Correlation Chart
The statistical analysis conducted on geographies consisting of 357,659,584 people shows a moderate positive correlation between the proportion of Hondurans and percentage of population with vision disability in the United States with a correlation coefficient (R) of 0.465 and weighted average of 2.5%. Similarly, the statistical analysis conducted on geographies consisting of 176,846,662 people shows no correlation between the proportion of Guyanese and percentage of population with vision disability in the United States with a correlation coefficient (R) of 0.041 and weighted average of 2.2%, a difference of 12.4%.
Vision Disability Correlation Summary
| Measurement | Honduran | Guyanese |
| Minimum | 0.42% | 0.061% |
| Maximum | 14.0% | 4.5% |
| Range | 13.5% | 4.4% |
| Mean | 3.0% | 2.2% |
| Median | 2.6% | 2.2% |
| Interquartile 25% (IQ1) | 2.3% | 1.7% |
| Interquartile 75% (IQ3) | 3.6% | 2.6% |
| Interquartile Range (IQR) | 1.3% | 0.97% |
| Standard Deviation (Sample) | 1.8% | 0.83% |
| Standard Deviation (Population) | 1.7% | 0.82% |
Similar Demographics by Vision Disability
Demographics Similar to Hondurans by Vision Disability
In terms of vision disability, the demographic groups most similar to Hondurans are French American Indian (2.5%, a difference of 0.020%), Sioux (2.5%, a difference of 0.14%), Immigrants from Central America (2.5%, a difference of 0.15%), Yakama (2.5%, a difference of 0.17%), and Nonimmigrants (2.5%, a difference of 0.43%).
| Demographics | Rating | Rank | Vision Disability |
| Cape Verdeans | 0.0 /100 | #280 | Tragic 2.4% |
| U.S. Virgin Islanders | 0.0 /100 | #281 | Tragic 2.5% |
| Immigrants | Caribbean | 0.0 /100 | #282 | Tragic 2.5% |
| Puget Sound Salish | 0.0 /100 | #283 | Tragic 2.5% |
| Yakama | 0.0 /100 | #284 | Tragic 2.5% |
| Immigrants | Central America | 0.0 /100 | #285 | Tragic 2.5% |
| Sioux | 0.0 /100 | #286 | Tragic 2.5% |
| Hondurans | 0.0 /100 | #287 | Tragic 2.5% |
| French American Indians | 0.0 /100 | #288 | Tragic 2.5% |
| Immigrants | Nonimmigrants | 0.0 /100 | #289 | Tragic 2.5% |
| Immigrants | Cuba | 0.0 /100 | #290 | Tragic 2.5% |
| Immigrants | Honduras | 0.0 /100 | #291 | Tragic 2.5% |
| Crow | 0.0 /100 | #292 | Tragic 2.5% |
| Yaqui | 0.0 /100 | #293 | Tragic 2.5% |
| Ottawa | 0.0 /100 | #294 | Tragic 2.5% |
Demographics Similar to Guyanese by Vision Disability
In terms of vision disability, the demographic groups most similar to Guyanese are Immigrants from St. Vincent and the Grenadines (2.2%, a difference of 0.11%), Salvadoran (2.2%, a difference of 0.11%), Immigrants from Costa Rica (2.2%, a difference of 0.22%), Canadian (2.2%, a difference of 0.24%), and European (2.2%, a difference of 0.24%).
| Demographics | Rating | Rank | Vision Disability |
| Immigrants | Western Europe | 41.1 /100 | #181 | Average 2.2% |
| Costa Ricans | 40.7 /100 | #182 | Average 2.2% |
| Immigrants | Burma/Myanmar | 37.9 /100 | #183 | Fair 2.2% |
| Moroccans | 35.4 /100 | #184 | Fair 2.2% |
| Immigrants | Middle Africa | 33.5 /100 | #185 | Fair 2.2% |
| Native Hawaiians | 33.3 /100 | #186 | Fair 2.2% |
| Immigrants | St. Vincent and the Grenadines | 30.3 /100 | #187 | Fair 2.2% |
| Guyanese | 28.9 /100 | #188 | Fair 2.2% |
| Salvadorans | 27.4 /100 | #189 | Fair 2.2% |
| Immigrants | Costa Rica | 26.1 /100 | #190 | Fair 2.2% |
| Canadians | 25.8 /100 | #191 | Fair 2.2% |
| Europeans | 25.7 /100 | #192 | Fair 2.2% |
| British | 25.1 /100 | #193 | Fair 2.2% |
| Immigrants | Barbados | 24.0 /100 | #194 | Fair 2.2% |
| Immigrants | Immigrants | 23.7 /100 | #195 | Fair 2.2% |