Honduran vs Cypriot Ambulatory Disability
COMPARE
Honduran
Cypriot
Ambulatory Disability
Ambulatory Disability Comparison
Hondurans
Cypriots
6.3%
AMBULATORY DISABILITY
6.3/ 100
METRIC RATING
225th/ 347
METRIC RANK
5.5%
AMBULATORY DISABILITY
100.0/ 100
METRIC RATING
38th/ 347
METRIC RANK
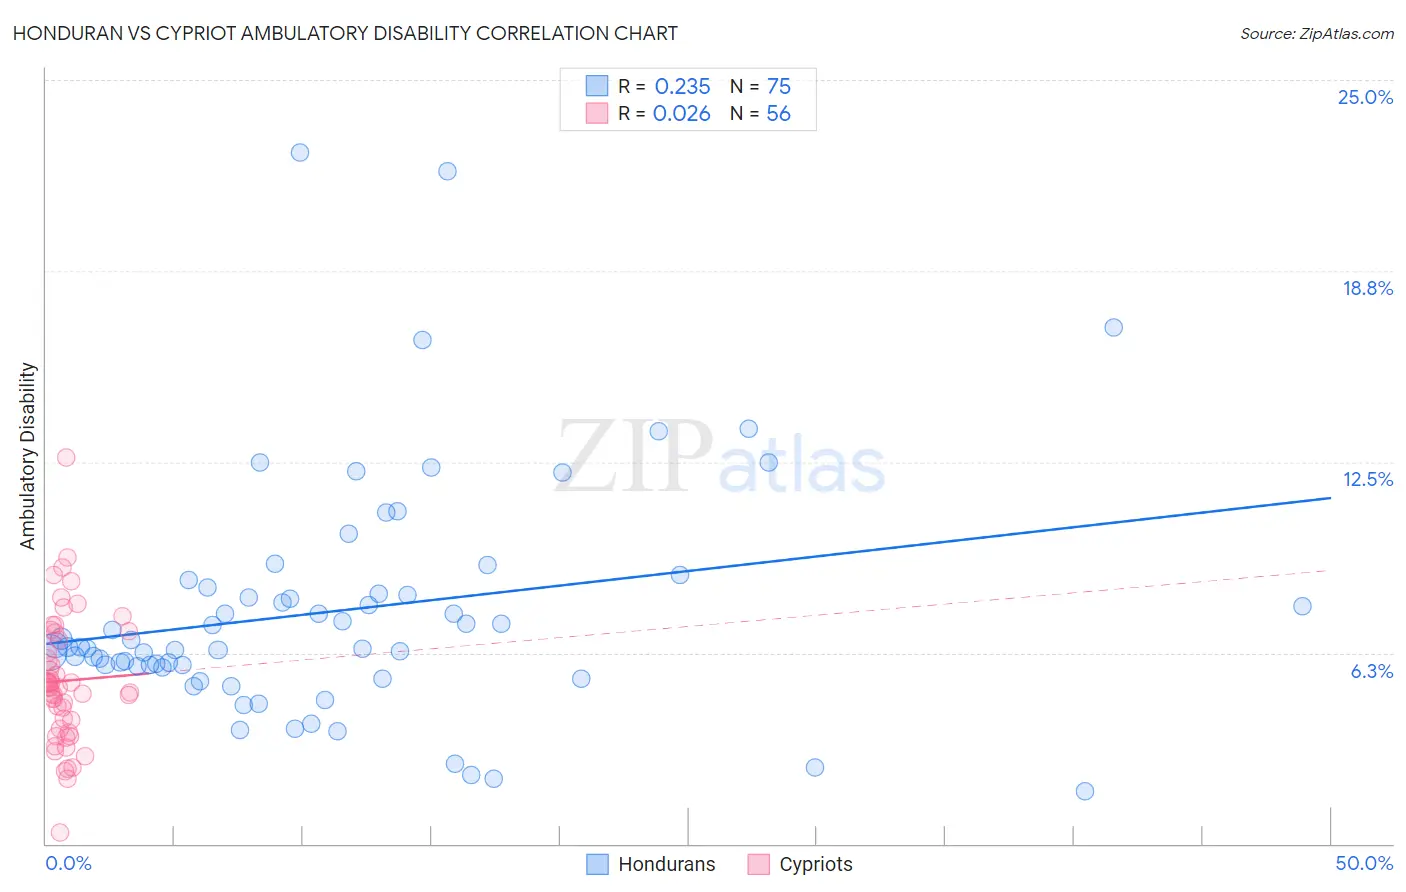
Honduran vs Cypriot Ambulatory Disability Correlation Chart
The statistical analysis conducted on geographies consisting of 357,719,276 people shows a weak positive correlation between the proportion of Hondurans and percentage of population with ambulatory disability in the United States with a correlation coefficient (R) of 0.235 and weighted average of 6.3%. Similarly, the statistical analysis conducted on geographies consisting of 61,870,126 people shows no correlation between the proportion of Cypriots and percentage of population with ambulatory disability in the United States with a correlation coefficient (R) of 0.026 and weighted average of 5.5%, a difference of 15.7%.
Ambulatory Disability Correlation Summary
| Measurement | Honduran | Cypriot |
| Minimum | 1.7% | 0.38% |
| Maximum | 22.6% | 12.7% |
| Range | 20.9% | 12.3% |
| Mean | 7.6% | 5.3% |
| Median | 6.4% | 5.1% |
| Interquartile 25% (IQ1) | 5.8% | 3.9% |
| Interquartile 75% (IQ3) | 8.4% | 6.8% |
| Interquartile Range (IQR) | 2.6% | 2.9% |
| Standard Deviation (Sample) | 3.9% | 2.1% |
| Standard Deviation (Population) | 3.9% | 2.1% |
Similar Demographics by Ambulatory Disability
Demographics Similar to Hondurans by Ambulatory Disability
In terms of ambulatory disability, the demographic groups most similar to Hondurans are Liberian (6.3%, a difference of 0.17%), Immigrants from Honduras (6.3%, a difference of 0.27%), Slavic (6.4%, a difference of 0.27%), German Russian (6.3%, a difference of 0.56%), and Hungarian (6.3%, a difference of 0.59%).
| Demographics | Rating | Rank | Ambulatory Disability |
| Guamanians/Chamorros | 10.6 /100 | #218 | Poor 6.3% |
| Indonesians | 9.9 /100 | #219 | Tragic 6.3% |
| Immigrants | Albania | 9.6 /100 | #220 | Tragic 6.3% |
| Hungarians | 9.6 /100 | #221 | Tragic 6.3% |
| German Russians | 9.4 /100 | #222 | Tragic 6.3% |
| Immigrants | Honduras | 7.6 /100 | #223 | Tragic 6.3% |
| Liberians | 7.1 /100 | #224 | Tragic 6.3% |
| Hondurans | 6.3 /100 | #225 | Tragic 6.3% |
| Slavs | 5.1 /100 | #226 | Tragic 6.4% |
| Cubans | 4.0 /100 | #227 | Tragic 6.4% |
| Portuguese | 4.0 /100 | #228 | Tragic 6.4% |
| Czechoslovakians | 3.8 /100 | #229 | Tragic 6.4% |
| Mexicans | 3.5 /100 | #230 | Tragic 6.4% |
| Panamanians | 3.1 /100 | #231 | Tragic 6.4% |
| Assyrians/Chaldeans/Syriacs | 2.4 /100 | #232 | Tragic 6.4% |
Demographics Similar to Cypriots by Ambulatory Disability
In terms of ambulatory disability, the demographic groups most similar to Cypriots are Turkish (5.5%, a difference of 0.010%), Immigrants from Malaysia (5.5%, a difference of 0.020%), Afghan (5.5%, a difference of 0.090%), Immigrants from Eritrea (5.5%, a difference of 0.090%), and Immigrants from Asia (5.5%, a difference of 0.13%).
| Demographics | Rating | Rank | Ambulatory Disability |
| Immigrants | Venezuela | 100.0 /100 | #31 | Exceptional 5.4% |
| Immigrants | Australia | 100.0 /100 | #32 | Exceptional 5.5% |
| Immigrants | Pakistan | 100.0 /100 | #33 | Exceptional 5.5% |
| Immigrants | Asia | 100.0 /100 | #34 | Exceptional 5.5% |
| Afghans | 100.0 /100 | #35 | Exceptional 5.5% |
| Immigrants | Malaysia | 100.0 /100 | #36 | Exceptional 5.5% |
| Turks | 100.0 /100 | #37 | Exceptional 5.5% |
| Cypriots | 100.0 /100 | #38 | Exceptional 5.5% |
| Immigrants | Eritrea | 100.0 /100 | #39 | Exceptional 5.5% |
| Venezuelans | 99.9 /100 | #40 | Exceptional 5.5% |
| Mongolians | 99.9 /100 | #41 | Exceptional 5.5% |
| Argentineans | 99.9 /100 | #42 | Exceptional 5.5% |
| Paraguayans | 99.9 /100 | #43 | Exceptional 5.5% |
| Immigrants | Indonesia | 99.9 /100 | #44 | Exceptional 5.5% |
| Immigrants | Sweden | 99.9 /100 | #45 | Exceptional 5.6% |