Hmong vs Immigrants from Moldova Disability Age 18 to 34
COMPARE
Hmong
Immigrants from Moldova
Disability Age 18 to 34
Disability Age 18 to 34 Comparison
Hmong
Immigrants from Moldova
8.1%
DISABILITY AGE 18 TO 34
0.0/ 100
METRIC RATING
317th/ 347
METRIC RANK
6.5%
DISABILITY AGE 18 TO 34
63.1/ 100
METRIC RATING
168th/ 347
METRIC RANK
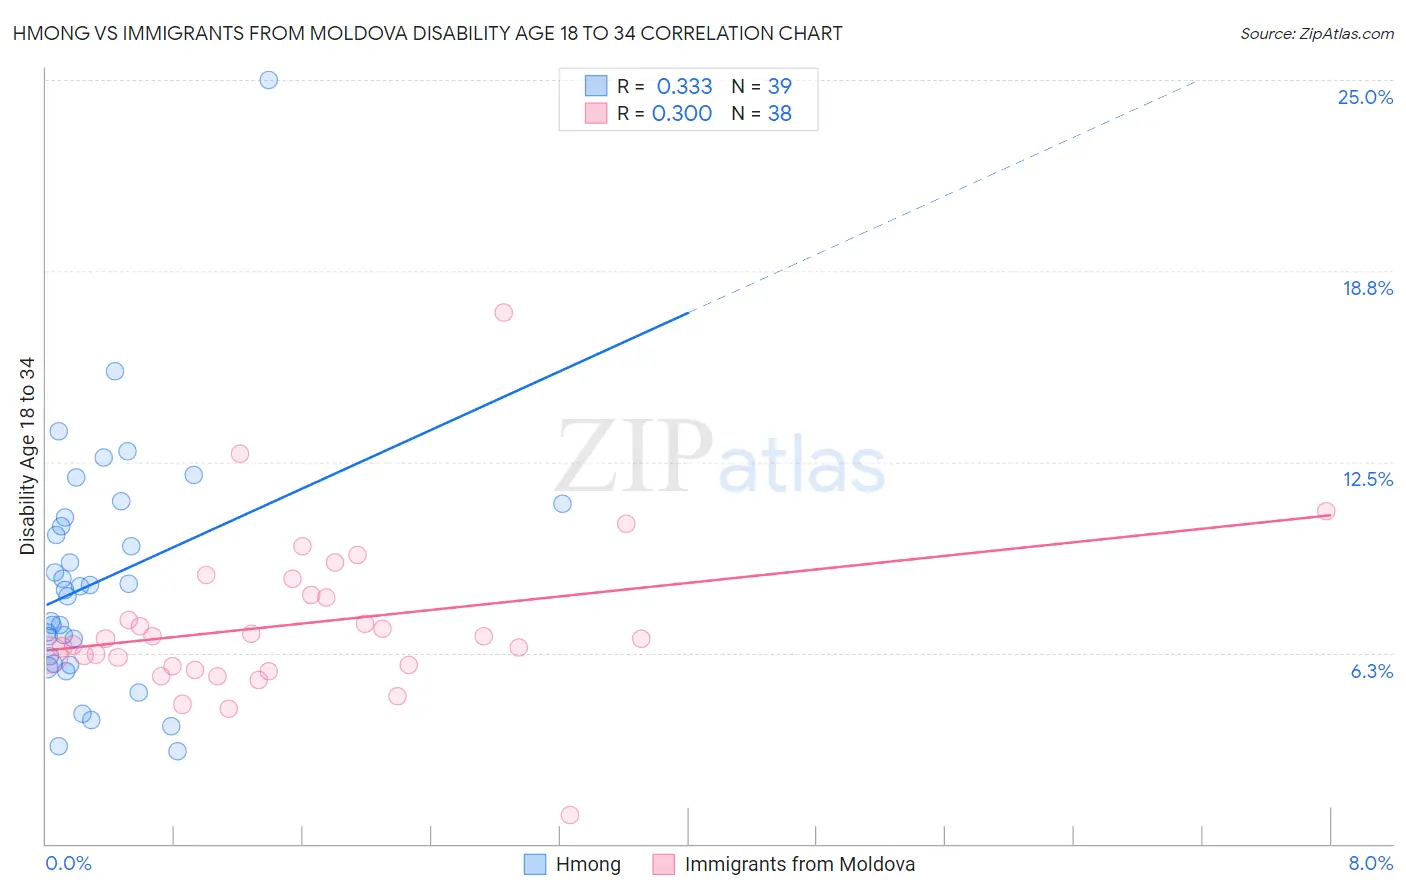
Hmong vs Immigrants from Moldova Disability Age 18 to 34 Correlation Chart
The statistical analysis conducted on geographies consisting of 24,681,034 people shows a mild positive correlation between the proportion of Hmong and percentage of population with a disability between the ages 18 and 35 in the United States with a correlation coefficient (R) of 0.333 and weighted average of 8.1%. Similarly, the statistical analysis conducted on geographies consisting of 124,268,822 people shows a weak positive correlation between the proportion of Immigrants from Moldova and percentage of population with a disability between the ages 18 and 35 in the United States with a correlation coefficient (R) of 0.300 and weighted average of 6.5%, a difference of 23.2%.
Disability Age 18 to 34 Correlation Summary
| Measurement | Hmong | Immigrants from Moldova |
| Minimum | 3.0% | 0.95% |
| Maximum | 25.0% | 17.4% |
| Range | 22.0% | 16.4% |
| Mean | 8.6% | 7.2% |
| Median | 8.3% | 6.7% |
| Interquartile 25% (IQ1) | 5.9% | 5.8% |
| Interquartile 75% (IQ3) | 10.7% | 8.1% |
| Interquartile Range (IQR) | 4.8% | 2.3% |
| Standard Deviation (Sample) | 4.0% | 2.7% |
| Standard Deviation (Population) | 4.0% | 2.6% |
Similar Demographics by Disability Age 18 to 34
Demographics Similar to Hmong by Disability Age 18 to 34
In terms of disability age 18 to 34, the demographic groups most similar to Hmong are French Canadian (8.1%, a difference of 0.42%), Puerto Rican (8.0%, a difference of 0.46%), Aleut (8.1%, a difference of 0.47%), Navajo (8.1%, a difference of 0.51%), and American (8.0%, a difference of 0.72%).
| Demographics | Rating | Rank | Disability Age 18 to 34 |
| Finns | 0.0 /100 | #310 | Tragic 7.8% |
| French | 0.0 /100 | #311 | Tragic 7.9% |
| Spanish Americans | 0.0 /100 | #312 | Tragic 7.9% |
| Iroquois | 0.0 /100 | #313 | Tragic 7.9% |
| Colville | 0.0 /100 | #314 | Tragic 7.9% |
| Americans | 0.0 /100 | #315 | Tragic 8.0% |
| Puerto Ricans | 0.0 /100 | #316 | Tragic 8.0% |
| Hmong | 0.0 /100 | #317 | Tragic 8.1% |
| French Canadians | 0.0 /100 | #318 | Tragic 8.1% |
| Aleuts | 0.0 /100 | #319 | Tragic 8.1% |
| Navajo | 0.0 /100 | #320 | Tragic 8.1% |
| Blackfeet | 0.0 /100 | #321 | Tragic 8.1% |
| Cree | 0.0 /100 | #322 | Tragic 8.1% |
| French American Indians | 0.0 /100 | #323 | Tragic 8.2% |
| Cajuns | 0.0 /100 | #324 | Tragic 8.2% |
Demographics Similar to Immigrants from Moldova by Disability Age 18 to 34
In terms of disability age 18 to 34, the demographic groups most similar to Immigrants from Moldova are Immigrants from Northern Europe (6.5%, a difference of 0.070%), Eastern European (6.5%, a difference of 0.16%), Russian (6.5%, a difference of 0.21%), Immigrants from Bahamas (6.6%, a difference of 0.38%), and Immigrants from Hungary (6.5%, a difference of 0.52%).
| Demographics | Rating | Rank | Disability Age 18 to 34 |
| Arabs | 72.3 /100 | #161 | Good 6.5% |
| South Africans | 71.7 /100 | #162 | Good 6.5% |
| Immigrants | Denmark | 71.7 /100 | #163 | Good 6.5% |
| Immigrants | Nigeria | 70.4 /100 | #164 | Good 6.5% |
| Immigrants | Hungary | 69.6 /100 | #165 | Good 6.5% |
| Eastern Europeans | 65.1 /100 | #166 | Good 6.5% |
| Immigrants | Northern Europe | 64.1 /100 | #167 | Good 6.5% |
| Immigrants | Moldova | 63.1 /100 | #168 | Good 6.5% |
| Russians | 60.2 /100 | #169 | Good 6.5% |
| Immigrants | Bahamas | 57.9 /100 | #170 | Average 6.6% |
| Bahamians | 55.5 /100 | #171 | Average 6.6% |
| Ghanaians | 54.7 /100 | #172 | Average 6.6% |
| Immigrants | Mexico | 54.1 /100 | #173 | Average 6.6% |
| Native Hawaiians | 50.0 /100 | #174 | Average 6.6% |
| Immigrants | Cambodia | 46.5 /100 | #175 | Average 6.6% |