Hispanic or Latino vs Immigrants from Venezuela Disability Age 35 to 64
COMPARE
Hispanic or Latino
Immigrants from Venezuela
Disability Age 35 to 64
Disability Age 35 to 64 Comparison
Hispanics or Latinos
Immigrants from Venezuela
12.3%
DISABILITY AGE 35 TO 64
1.3/ 100
METRIC RATING
249th/ 347
METRIC RANK
9.3%
DISABILITY AGE 35 TO 64
100.0/ 100
METRIC RATING
19th/ 347
METRIC RANK
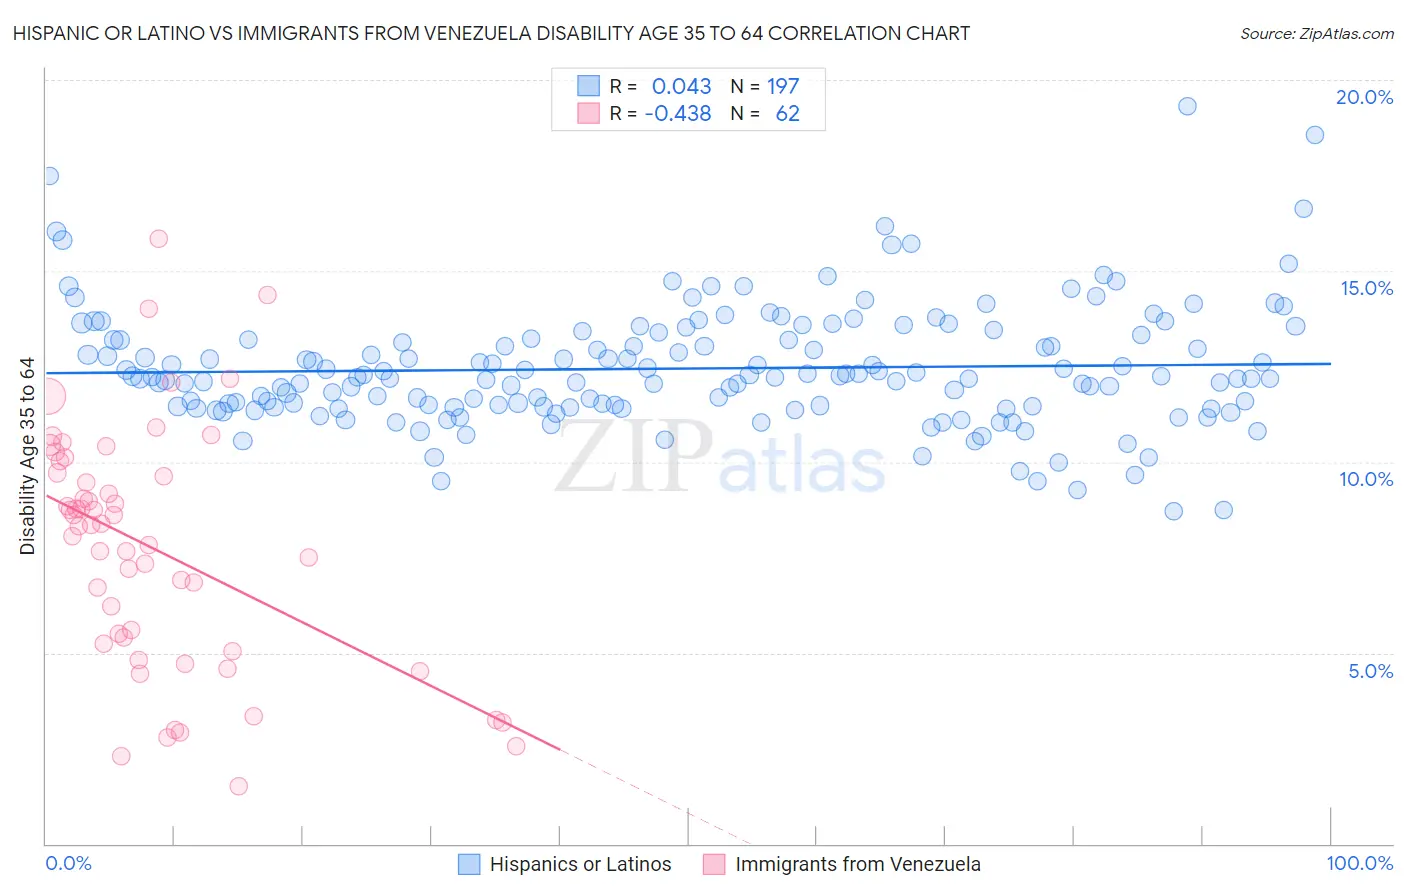
Hispanic or Latino vs Immigrants from Venezuela Disability Age 35 to 64 Correlation Chart
The statistical analysis conducted on geographies consisting of 573,735,758 people shows no correlation between the proportion of Hispanics or Latinos and percentage of population with a disability between the ages 34 and 64 in the United States with a correlation coefficient (R) of 0.043 and weighted average of 12.3%. Similarly, the statistical analysis conducted on geographies consisting of 287,770,469 people shows a moderate negative correlation between the proportion of Immigrants from Venezuela and percentage of population with a disability between the ages 34 and 64 in the United States with a correlation coefficient (R) of -0.438 and weighted average of 9.3%, a difference of 32.2%.
Disability Age 35 to 64 Correlation Summary
| Measurement | Hispanic or Latino | Immigrants from Venezuela |
| Minimum | 8.7% | 1.5% |
| Maximum | 19.3% | 15.9% |
| Range | 10.6% | 14.3% |
| Mean | 12.4% | 7.7% |
| Median | 12.2% | 8.3% |
| Interquartile 25% (IQ1) | 11.4% | 5.2% |
| Interquartile 75% (IQ3) | 13.2% | 9.7% |
| Interquartile Range (IQR) | 1.8% | 4.5% |
| Standard Deviation (Sample) | 1.6% | 3.1% |
| Standard Deviation (Population) | 1.6% | 3.1% |
Similar Demographics by Disability Age 35 to 64
Demographics Similar to Hispanics or Latinos by Disability Age 35 to 64
In terms of disability age 35 to 64, the demographic groups most similar to Hispanics or Latinos are Spaniard (12.3%, a difference of 0.030%), Immigrants from Senegal (12.2%, a difference of 0.12%), Immigrants from Burma/Myanmar (12.3%, a difference of 0.13%), Guamanian/Chamorro (12.2%, a difference of 0.16%), and German (12.3%, a difference of 0.21%).
| Demographics | Rating | Rank | Disability Age 35 to 64 |
| Samoans | 2.8 /100 | #242 | Tragic 12.1% |
| Slovaks | 2.7 /100 | #243 | Tragic 12.1% |
| Finns | 2.3 /100 | #244 | Tragic 12.1% |
| Immigrants | Mexico | 2.2 /100 | #245 | Tragic 12.1% |
| Guamanians/Chamorros | 1.4 /100 | #246 | Tragic 12.2% |
| Immigrants | Senegal | 1.3 /100 | #247 | Tragic 12.2% |
| Spaniards | 1.3 /100 | #248 | Tragic 12.3% |
| Hispanics or Latinos | 1.3 /100 | #249 | Tragic 12.3% |
| Immigrants | Burma/Myanmar | 1.2 /100 | #250 | Tragic 12.3% |
| Germans | 1.1 /100 | #251 | Tragic 12.3% |
| Irish | 1.0 /100 | #252 | Tragic 12.3% |
| Dutch | 1.0 /100 | #253 | Tragic 12.3% |
| Hawaiians | 0.9 /100 | #254 | Tragic 12.3% |
| Japanese | 0.8 /100 | #255 | Tragic 12.3% |
| Scottish | 0.8 /100 | #256 | Tragic 12.4% |
Demographics Similar to Immigrants from Venezuela by Disability Age 35 to 64
In terms of disability age 35 to 64, the demographic groups most similar to Immigrants from Venezuela are Soviet Union (9.2%, a difference of 0.24%), Immigrants from Argentina (9.3%, a difference of 0.51%), Burmese (9.2%, a difference of 0.65%), Okinawan (9.4%, a difference of 0.94%), and Cypriot (9.4%, a difference of 0.97%).
| Demographics | Rating | Rank | Disability Age 35 to 64 |
| Indians (Asian) | 100.0 /100 | #12 | Exceptional 8.9% |
| Immigrants | South Central Asia | 100.0 /100 | #13 | Exceptional 8.9% |
| Immigrants | Singapore | 100.0 /100 | #14 | Exceptional 8.9% |
| Bolivians | 100.0 /100 | #15 | Exceptional 8.9% |
| Immigrants | Korea | 100.0 /100 | #16 | Exceptional 9.0% |
| Burmese | 100.0 /100 | #17 | Exceptional 9.2% |
| Soviet Union | 100.0 /100 | #18 | Exceptional 9.2% |
| Immigrants | Venezuela | 100.0 /100 | #19 | Exceptional 9.3% |
| Immigrants | Argentina | 100.0 /100 | #20 | Exceptional 9.3% |
| Okinawans | 100.0 /100 | #21 | Exceptional 9.4% |
| Cypriots | 100.0 /100 | #22 | Exceptional 9.4% |
| Argentineans | 100.0 /100 | #23 | Exceptional 9.4% |
| Asians | 100.0 /100 | #24 | Exceptional 9.4% |
| Venezuelans | 100.0 /100 | #25 | Exceptional 9.4% |
| Immigrants | Sri Lanka | 100.0 /100 | #26 | Exceptional 9.5% |