Hawaiian vs Slovak Disability Age 35 to 64
COMPARE
Hawaiian
Slovak
Disability Age 35 to 64
Disability Age 35 to 64 Comparison
Hawaiians
Slovaks
12.3%
DISABILITY AGE 35 TO 64
0.9/ 100
METRIC RATING
254th/ 347
METRIC RANK
12.1%
DISABILITY AGE 35 TO 64
2.7/ 100
METRIC RATING
243rd/ 347
METRIC RANK
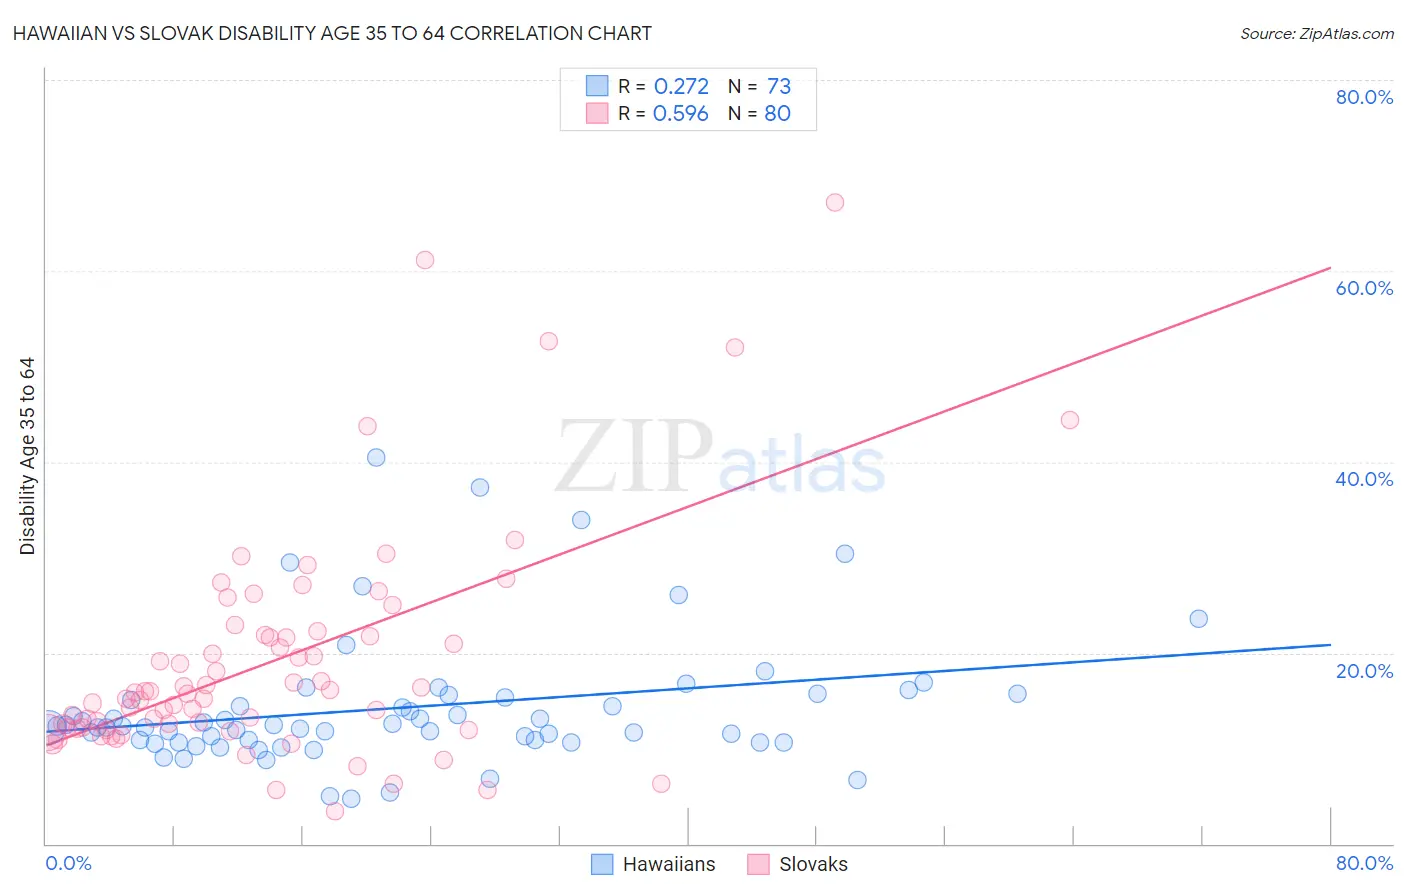
Hawaiian vs Slovak Disability Age 35 to 64 Correlation Chart
The statistical analysis conducted on geographies consisting of 327,340,087 people shows a weak positive correlation between the proportion of Hawaiians and percentage of population with a disability between the ages 34 and 64 in the United States with a correlation coefficient (R) of 0.272 and weighted average of 12.3%. Similarly, the statistical analysis conducted on geographies consisting of 397,624,884 people shows a substantial positive correlation between the proportion of Slovaks and percentage of population with a disability between the ages 34 and 64 in the United States with a correlation coefficient (R) of 0.596 and weighted average of 12.1%, a difference of 2.1%.
Disability Age 35 to 64 Correlation Summary
| Measurement | Hawaiian | Slovak |
| Minimum | 4.7% | 3.4% |
| Maximum | 40.5% | 67.2% |
| Range | 35.8% | 63.8% |
| Mean | 14.2% | 19.1% |
| Median | 12.3% | 15.8% |
| Interquartile 25% (IQ1) | 10.7% | 12.1% |
| Interquartile 75% (IQ3) | 15.5% | 21.8% |
| Interquartile Range (IQR) | 4.7% | 9.7% |
| Standard Deviation (Sample) | 6.8% | 11.9% |
| Standard Deviation (Population) | 6.8% | 11.8% |
Demographics Similar to Hawaiians and Slovaks by Disability Age 35 to 64
In terms of disability age 35 to 64, the demographic groups most similar to Hawaiians are Dutch (12.3%, a difference of 0.11%), Japanese (12.3%, a difference of 0.13%), Irish (12.3%, a difference of 0.14%), Scottish (12.4%, a difference of 0.30%), and German (12.3%, a difference of 0.40%). Similarly, the demographic groups most similar to Slovaks are Samoan (12.1%, a difference of 0.10%), Finnish (12.1%, a difference of 0.26%), Immigrants from Mexico (12.1%, a difference of 0.36%), Mexican American Indian (12.0%, a difference of 0.37%), and Immigrants from Thailand (12.0%, a difference of 0.39%).
| Demographics | Rating | Rank | Disability Age 35 to 64 |
| West Indians | 3.7 /100 | #238 | Tragic 12.0% |
| Immigrants | Western Africa | 3.3 /100 | #239 | Tragic 12.0% |
| Immigrants | Thailand | 3.3 /100 | #240 | Tragic 12.0% |
| Mexican American Indians | 3.2 /100 | #241 | Tragic 12.0% |
| Samoans | 2.8 /100 | #242 | Tragic 12.1% |
| Slovaks | 2.7 /100 | #243 | Tragic 12.1% |
| Finns | 2.3 /100 | #244 | Tragic 12.1% |
| Immigrants | Mexico | 2.2 /100 | #245 | Tragic 12.1% |
| Guamanians/Chamorros | 1.4 /100 | #246 | Tragic 12.2% |
| Immigrants | Senegal | 1.3 /100 | #247 | Tragic 12.2% |
| Spaniards | 1.3 /100 | #248 | Tragic 12.3% |
| Hispanics or Latinos | 1.3 /100 | #249 | Tragic 12.3% |
| Immigrants | Burma/Myanmar | 1.2 /100 | #250 | Tragic 12.3% |
| Germans | 1.1 /100 | #251 | Tragic 12.3% |
| Irish | 1.0 /100 | #252 | Tragic 12.3% |
| Dutch | 1.0 /100 | #253 | Tragic 12.3% |
| Hawaiians | 0.9 /100 | #254 | Tragic 12.3% |
| Japanese | 0.8 /100 | #255 | Tragic 12.3% |
| Scottish | 0.8 /100 | #256 | Tragic 12.4% |
| Mexicans | 0.7 /100 | #257 | Tragic 12.4% |
| Welsh | 0.6 /100 | #258 | Tragic 12.4% |