Hawaiian vs Immigrants from Iraq Ambulatory Disability
COMPARE
Hawaiian
Immigrants from Iraq
Ambulatory Disability
Ambulatory Disability Comparison
Hawaiians
Immigrants from Iraq
6.5%
AMBULATORY DISABILITY
0.9/ 100
METRIC RATING
251st/ 347
METRIC RANK
6.3%
AMBULATORY DISABILITY
14.0/ 100
METRIC RATING
209th/ 347
METRIC RANK
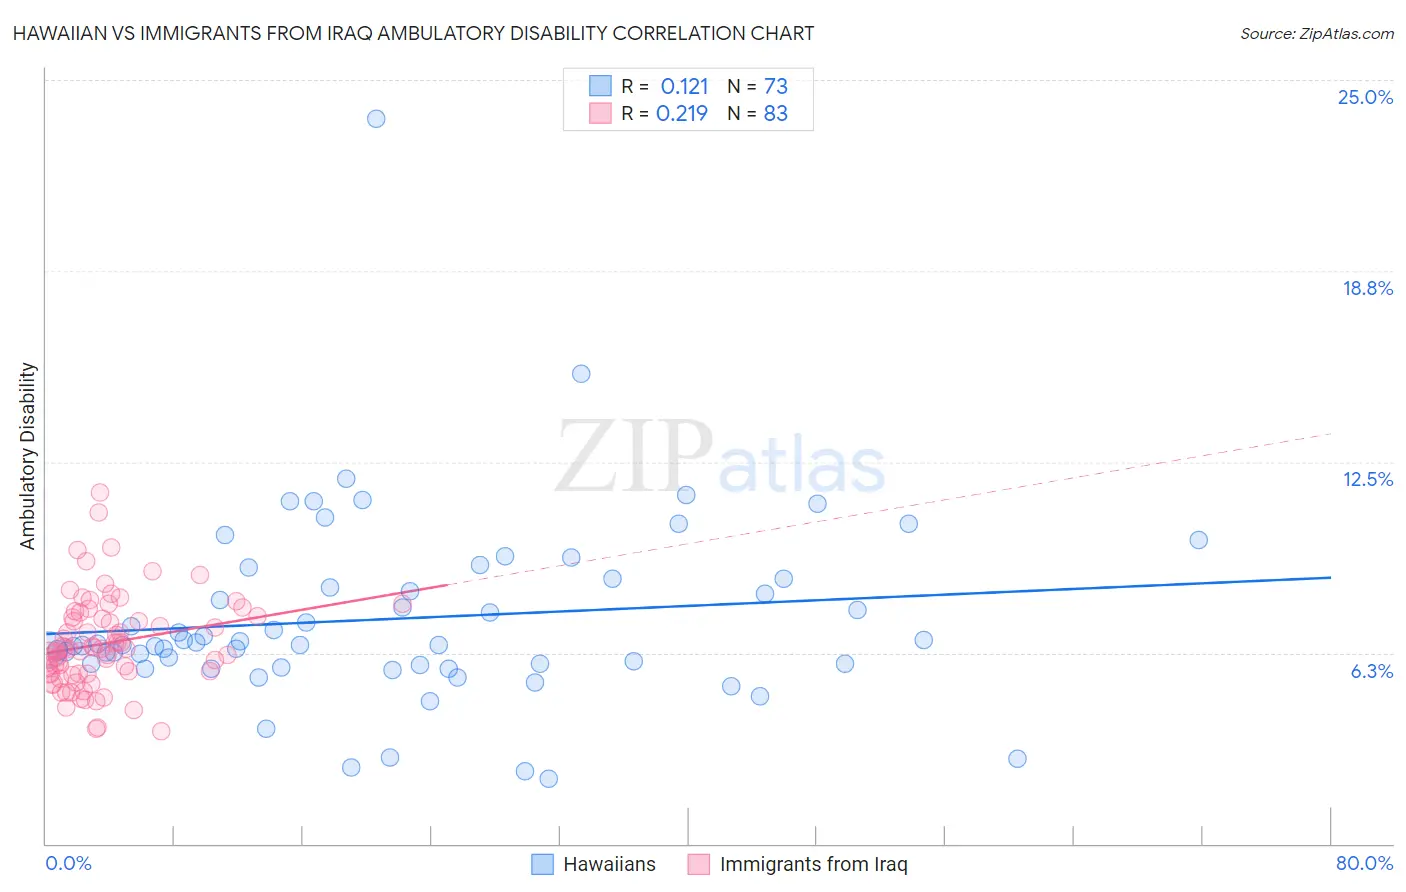
Hawaiian vs Immigrants from Iraq Ambulatory Disability Correlation Chart
The statistical analysis conducted on geographies consisting of 327,430,219 people shows a poor positive correlation between the proportion of Hawaiians and percentage of population with ambulatory disability in the United States with a correlation coefficient (R) of 0.121 and weighted average of 6.5%. Similarly, the statistical analysis conducted on geographies consisting of 194,765,362 people shows a weak positive correlation between the proportion of Immigrants from Iraq and percentage of population with ambulatory disability in the United States with a correlation coefficient (R) of 0.219 and weighted average of 6.3%, a difference of 3.7%.
Ambulatory Disability Correlation Summary
| Measurement | Hawaiian | Immigrants from Iraq |
| Minimum | 2.1% | 3.7% |
| Maximum | 23.7% | 11.5% |
| Range | 21.6% | 7.8% |
| Mean | 7.4% | 6.6% |
| Median | 6.5% | 6.4% |
| Interquartile 25% (IQ1) | 5.9% | 5.6% |
| Interquartile 75% (IQ3) | 8.7% | 7.4% |
| Interquartile Range (IQR) | 2.8% | 1.9% |
| Standard Deviation (Sample) | 3.1% | 1.5% |
| Standard Deviation (Population) | 3.1% | 1.5% |
Similar Demographics by Ambulatory Disability
Demographics Similar to Hawaiians by Ambulatory Disability
In terms of ambulatory disability, the demographic groups most similar to Hawaiians are Chinese (6.5%, a difference of 0.18%), Immigrants from Bahamas (6.5%, a difference of 0.20%), Scottish (6.5%, a difference of 0.25%), Native Hawaiian (6.5%, a difference of 0.26%), and Belizean (6.5%, a difference of 0.41%).
| Demographics | Rating | Rank | Ambulatory Disability |
| Immigrants | Panama | 1.5 /100 | #244 | Tragic 6.5% |
| Tlingit-Haida | 1.5 /100 | #245 | Tragic 6.5% |
| Armenians | 1.5 /100 | #246 | Tragic 6.5% |
| Immigrants | Cuba | 1.4 /100 | #247 | Tragic 6.5% |
| Immigrants | Portugal | 1.4 /100 | #248 | Tragic 6.5% |
| Native Hawaiians | 1.1 /100 | #249 | Tragic 6.5% |
| Chinese | 1.0 /100 | #250 | Tragic 6.5% |
| Hawaiians | 0.9 /100 | #251 | Tragic 6.5% |
| Immigrants | Bahamas | 0.8 /100 | #252 | Tragic 6.5% |
| Scottish | 0.7 /100 | #253 | Tragic 6.5% |
| Belizeans | 0.7 /100 | #254 | Tragic 6.5% |
| Welsh | 0.6 /100 | #255 | Tragic 6.5% |
| Immigrants | Uzbekistan | 0.6 /100 | #256 | Tragic 6.5% |
| Bermudans | 0.5 /100 | #257 | Tragic 6.5% |
| Spanish American Indians | 0.5 /100 | #258 | Tragic 6.5% |
Demographics Similar to Immigrants from Iraq by Ambulatory Disability
In terms of ambulatory disability, the demographic groups most similar to Immigrants from Iraq are Bangladeshi (6.3%, a difference of 0.020%), Immigrants from Laos (6.3%, a difference of 0.080%), Alsatian (6.3%, a difference of 0.11%), Samoan (6.3%, a difference of 0.22%), and Mexican American Indian (6.3%, a difference of 0.23%).
| Demographics | Rating | Rank | Ambulatory Disability |
| Albanians | 19.7 /100 | #202 | Poor 6.2% |
| Immigrants | Ukraine | 18.4 /100 | #203 | Poor 6.2% |
| Immigrants | Congo | 18.2 /100 | #204 | Poor 6.2% |
| Slovenes | 18.0 /100 | #205 | Poor 6.2% |
| Finns | 17.2 /100 | #206 | Poor 6.2% |
| Alsatians | 15.1 /100 | #207 | Poor 6.3% |
| Bangladeshis | 14.2 /100 | #208 | Poor 6.3% |
| Immigrants | Iraq | 14.0 /100 | #209 | Poor 6.3% |
| Immigrants | Laos | 13.2 /100 | #210 | Poor 6.3% |
| Samoans | 12.1 /100 | #211 | Poor 6.3% |
| Mexican American Indians | 12.0 /100 | #212 | Poor 6.3% |
| Japanese | 12.0 /100 | #213 | Poor 6.3% |
| Immigrants | Mexico | 11.0 /100 | #214 | Poor 6.3% |
| Immigrants | Latin America | 11.0 /100 | #215 | Poor 6.3% |
| Canadians | 10.9 /100 | #216 | Poor 6.3% |