Haitian vs Mexican American Indian Cognitive Disability
COMPARE
Haitian
Mexican American Indian
Cognitive Disability
Cognitive Disability Comparison
Haitians
Mexican American Indians
17.5%
COGNITIVE DISABILITY
14.1/ 100
METRIC RATING
200th/ 347
METRIC RANK
17.9%
COGNITIVE DISABILITY
0.6/ 100
METRIC RATING
257th/ 347
METRIC RANK
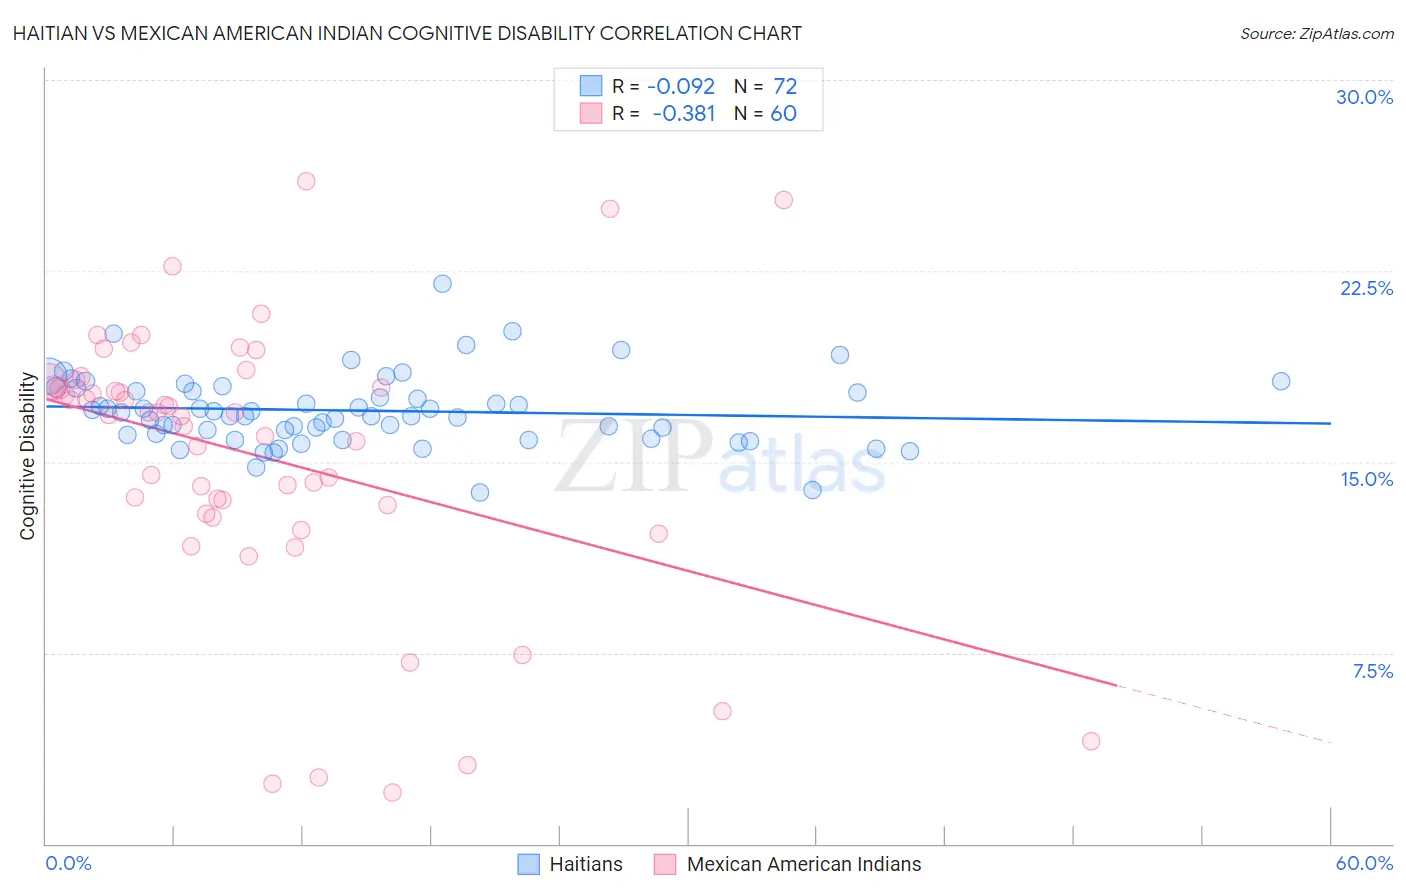
Haitian vs Mexican American Indian Cognitive Disability Correlation Chart
The statistical analysis conducted on geographies consisting of 287,929,830 people shows a slight negative correlation between the proportion of Haitians and percentage of population with cognitive disability in the United States with a correlation coefficient (R) of -0.092 and weighted average of 17.5%. Similarly, the statistical analysis conducted on geographies consisting of 317,571,331 people shows a mild negative correlation between the proportion of Mexican American Indians and percentage of population with cognitive disability in the United States with a correlation coefficient (R) of -0.381 and weighted average of 17.9%, a difference of 2.4%.
Cognitive Disability Correlation Summary
| Measurement | Haitian | Mexican American Indian |
| Minimum | 13.8% | 2.0% |
| Maximum | 22.0% | 26.0% |
| Range | 8.2% | 24.0% |
| Mean | 17.0% | 15.2% |
| Median | 16.9% | 16.9% |
| Interquartile 25% (IQ1) | 16.1% | 13.1% |
| Interquartile 75% (IQ3) | 17.8% | 18.0% |
| Interquartile Range (IQR) | 1.8% | 4.9% |
| Standard Deviation (Sample) | 1.4% | 5.4% |
| Standard Deviation (Population) | 1.4% | 5.4% |
Similar Demographics by Cognitive Disability
Demographics Similar to Haitians by Cognitive Disability
In terms of cognitive disability, the demographic groups most similar to Haitians are Immigrants from Singapore (17.5%, a difference of 0.010%), Immigrants from Panama (17.5%, a difference of 0.040%), South American Indian (17.5%, a difference of 0.070%), Immigrants from Morocco (17.5%, a difference of 0.13%), and Immigrants from Afghanistan (17.5%, a difference of 0.14%).
| Demographics | Rating | Rank | Cognitive Disability |
| Delaware | 25.6 /100 | #193 | Fair 17.4% |
| Immigrants | Bosnia and Herzegovina | 22.0 /100 | #194 | Fair 17.4% |
| New Zealanders | 21.1 /100 | #195 | Fair 17.4% |
| Guyanese | 17.5 /100 | #196 | Poor 17.5% |
| Immigrants | Afghanistan | 16.7 /100 | #197 | Poor 17.5% |
| Immigrants | Panama | 14.8 /100 | #198 | Poor 17.5% |
| Immigrants | Singapore | 14.3 /100 | #199 | Poor 17.5% |
| Haitians | 14.1 /100 | #200 | Poor 17.5% |
| South American Indians | 13.0 /100 | #201 | Poor 17.5% |
| Immigrants | Morocco | 12.0 /100 | #202 | Poor 17.5% |
| Immigrants | Caribbean | 11.0 /100 | #203 | Poor 17.5% |
| Immigrants | Zimbabwe | 11.0 /100 | #204 | Poor 17.5% |
| Puget Sound Salish | 10.9 /100 | #205 | Poor 17.5% |
| Alaska Natives | 10.4 /100 | #206 | Poor 17.5% |
| Immigrants | Latin America | 9.7 /100 | #207 | Tragic 17.6% |
Demographics Similar to Mexican American Indians by Cognitive Disability
In terms of cognitive disability, the demographic groups most similar to Mexican American Indians are Immigrants from Armenia (17.9%, a difference of 0.010%), Bahamian (17.9%, a difference of 0.040%), Hopi (17.9%, a difference of 0.050%), Hispanic or Latino (17.9%, a difference of 0.050%), and Immigrants from the Azores (17.9%, a difference of 0.050%).
| Demographics | Rating | Rank | Cognitive Disability |
| Immigrants | Ethiopia | 0.7 /100 | #250 | Tragic 17.9% |
| Malaysians | 0.6 /100 | #251 | Tragic 17.9% |
| Immigrants | Grenada | 0.6 /100 | #252 | Tragic 17.9% |
| Hopi | 0.6 /100 | #253 | Tragic 17.9% |
| Hispanics or Latinos | 0.6 /100 | #254 | Tragic 17.9% |
| Immigrants | Azores | 0.6 /100 | #255 | Tragic 17.9% |
| Bahamians | 0.6 /100 | #256 | Tragic 17.9% |
| Mexican American Indians | 0.6 /100 | #257 | Tragic 17.9% |
| Immigrants | Armenia | 0.6 /100 | #258 | Tragic 17.9% |
| Ethiopians | 0.5 /100 | #259 | Tragic 17.9% |
| Immigrants | Belize | 0.5 /100 | #260 | Tragic 17.9% |
| Guamanians/Chamorros | 0.5 /100 | #261 | Tragic 17.9% |
| Sierra Leoneans | 0.4 /100 | #262 | Tragic 17.9% |
| Immigrants | Barbados | 0.4 /100 | #263 | Tragic 17.9% |
| Menominee | 0.4 /100 | #264 | Tragic 18.0% |