Guyanese vs Immigrants from Ukraine Disability Age Over 75
COMPARE
Guyanese
Immigrants from Ukraine
Disability Age Over 75
Disability Age Over 75 Comparison
Guyanese
Immigrants from Ukraine
46.9%
DISABILITY AGE OVER 75
84.3/ 100
METRIC RATING
146th/ 347
METRIC RANK
47.7%
DISABILITY AGE OVER 75
23.2/ 100
METRIC RATING
198th/ 347
METRIC RANK
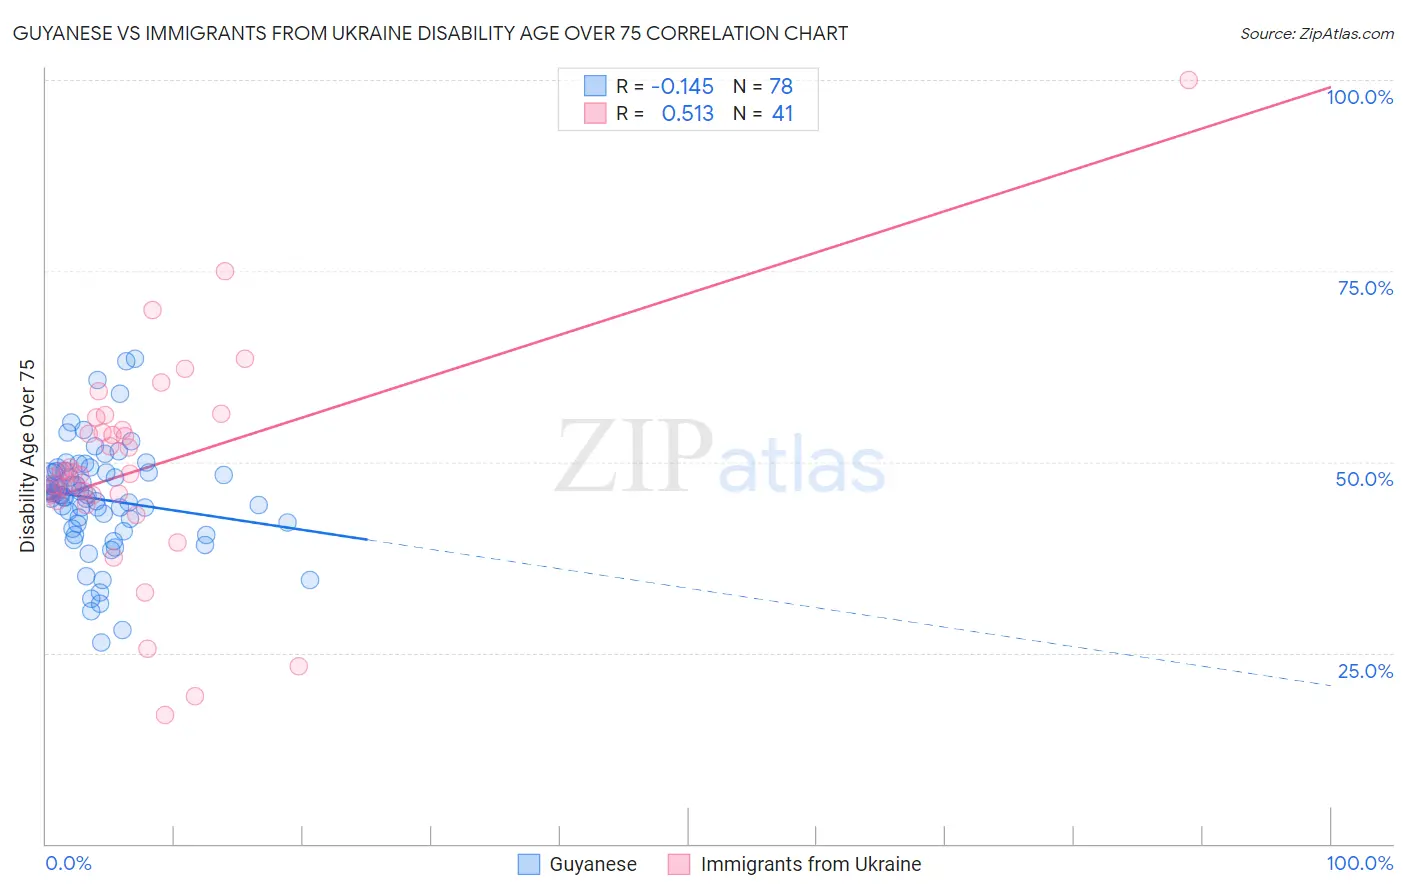
Guyanese vs Immigrants from Ukraine Disability Age Over 75 Correlation Chart
The statistical analysis conducted on geographies consisting of 176,616,410 people shows a poor negative correlation between the proportion of Guyanese and percentage of population with a disability over the age of 75 in the United States with a correlation coefficient (R) of -0.145 and weighted average of 46.9%. Similarly, the statistical analysis conducted on geographies consisting of 289,393,275 people shows a substantial positive correlation between the proportion of Immigrants from Ukraine and percentage of population with a disability over the age of 75 in the United States with a correlation coefficient (R) of 0.513 and weighted average of 47.7%, a difference of 1.6%.
Disability Age Over 75 Correlation Summary
| Measurement | Guyanese | Immigrants from Ukraine |
| Minimum | 26.4% | 16.9% |
| Maximum | 63.4% | 100.0% |
| Range | 37.1% | 83.1% |
| Mean | 45.1% | 49.3% |
| Median | 45.7% | 48.7% |
| Interquartile 25% (IQ1) | 41.8% | 45.2% |
| Interquartile 75% (IQ3) | 48.6% | 55.0% |
| Interquartile Range (IQR) | 6.8% | 9.8% |
| Standard Deviation (Sample) | 7.1% | 14.4% |
| Standard Deviation (Population) | 7.0% | 14.3% |
Similar Demographics by Disability Age Over 75
Demographics Similar to Guyanese by Disability Age Over 75
In terms of disability age over 75, the demographic groups most similar to Guyanese are Costa Rican (46.9%, a difference of 0.010%), Immigrants from Peru (46.9%, a difference of 0.010%), Venezuelan (46.9%, a difference of 0.030%), Bermudan (46.9%, a difference of 0.060%), and Peruvian (46.8%, a difference of 0.10%).
| Demographics | Rating | Rank | Disability Age Over 75 |
| Yugoslavians | 88.5 /100 | #139 | Excellent 46.8% |
| Immigrants | Costa Rica | 87.4 /100 | #140 | Excellent 46.8% |
| Lebanese | 87.0 /100 | #141 | Excellent 46.8% |
| Peruvians | 86.5 /100 | #142 | Excellent 46.8% |
| Bermudans | 85.6 /100 | #143 | Excellent 46.9% |
| Venezuelans | 85.0 /100 | #144 | Excellent 46.9% |
| Costa Ricans | 84.5 /100 | #145 | Excellent 46.9% |
| Guyanese | 84.3 /100 | #146 | Excellent 46.9% |
| Immigrants | Peru | 84.1 /100 | #147 | Excellent 46.9% |
| Asians | 81.6 /100 | #148 | Excellent 46.9% |
| Welsh | 81.3 /100 | #149 | Excellent 47.0% |
| Immigrants | Russia | 79.3 /100 | #150 | Good 47.0% |
| French Canadians | 79.0 /100 | #151 | Good 47.0% |
| Immigrants | Asia | 76.5 /100 | #152 | Good 47.0% |
| Immigrants | Zaire | 74.8 /100 | #153 | Good 47.1% |
Demographics Similar to Immigrants from Ukraine by Disability Age Over 75
In terms of disability age over 75, the demographic groups most similar to Immigrants from Ukraine are Pakistani (47.7%, a difference of 0.010%), Immigrants from Portugal (47.6%, a difference of 0.020%), Immigrants from Eritrea (47.7%, a difference of 0.020%), Immigrants from Trinidad and Tobago (47.6%, a difference of 0.060%), and Immigrants from Somalia (47.7%, a difference of 0.060%).
| Demographics | Rating | Rank | Disability Age Over 75 |
| Portuguese | 29.3 /100 | #191 | Fair 47.6% |
| Immigrants | Jamaica | 28.3 /100 | #192 | Fair 47.6% |
| Ottawa | 28.1 /100 | #193 | Fair 47.6% |
| Immigrants | Lebanon | 26.5 /100 | #194 | Fair 47.6% |
| Immigrants | Trinidad and Tobago | 25.3 /100 | #195 | Fair 47.6% |
| Immigrants | Portugal | 23.8 /100 | #196 | Fair 47.6% |
| Pakistanis | 23.4 /100 | #197 | Fair 47.7% |
| Immigrants | Ukraine | 23.2 /100 | #198 | Fair 47.7% |
| Immigrants | Eritrea | 22.4 /100 | #199 | Fair 47.7% |
| Immigrants | Somalia | 21.4 /100 | #200 | Fair 47.7% |
| Immigrants | Cuba | 20.9 /100 | #201 | Fair 47.7% |
| Immigrants | Bahamas | 20.7 /100 | #202 | Fair 47.7% |
| Trinidadians and Tobagonians | 20.0 /100 | #203 | Fair 47.7% |
| Nigerians | 19.2 /100 | #204 | Poor 47.7% |
| Immigrants | Ghana | 19.1 /100 | #205 | Poor 47.7% |