Guatemalan vs Creek Hearing Disability
COMPARE
Guatemalan
Creek
Hearing Disability
Hearing Disability Comparison
Guatemalans
Creek
2.8%
HEARING DISABILITY
93.2/ 100
METRIC RATING
108th/ 347
METRIC RANK
4.4%
HEARING DISABILITY
0.0/ 100
METRIC RATING
336th/ 347
METRIC RANK
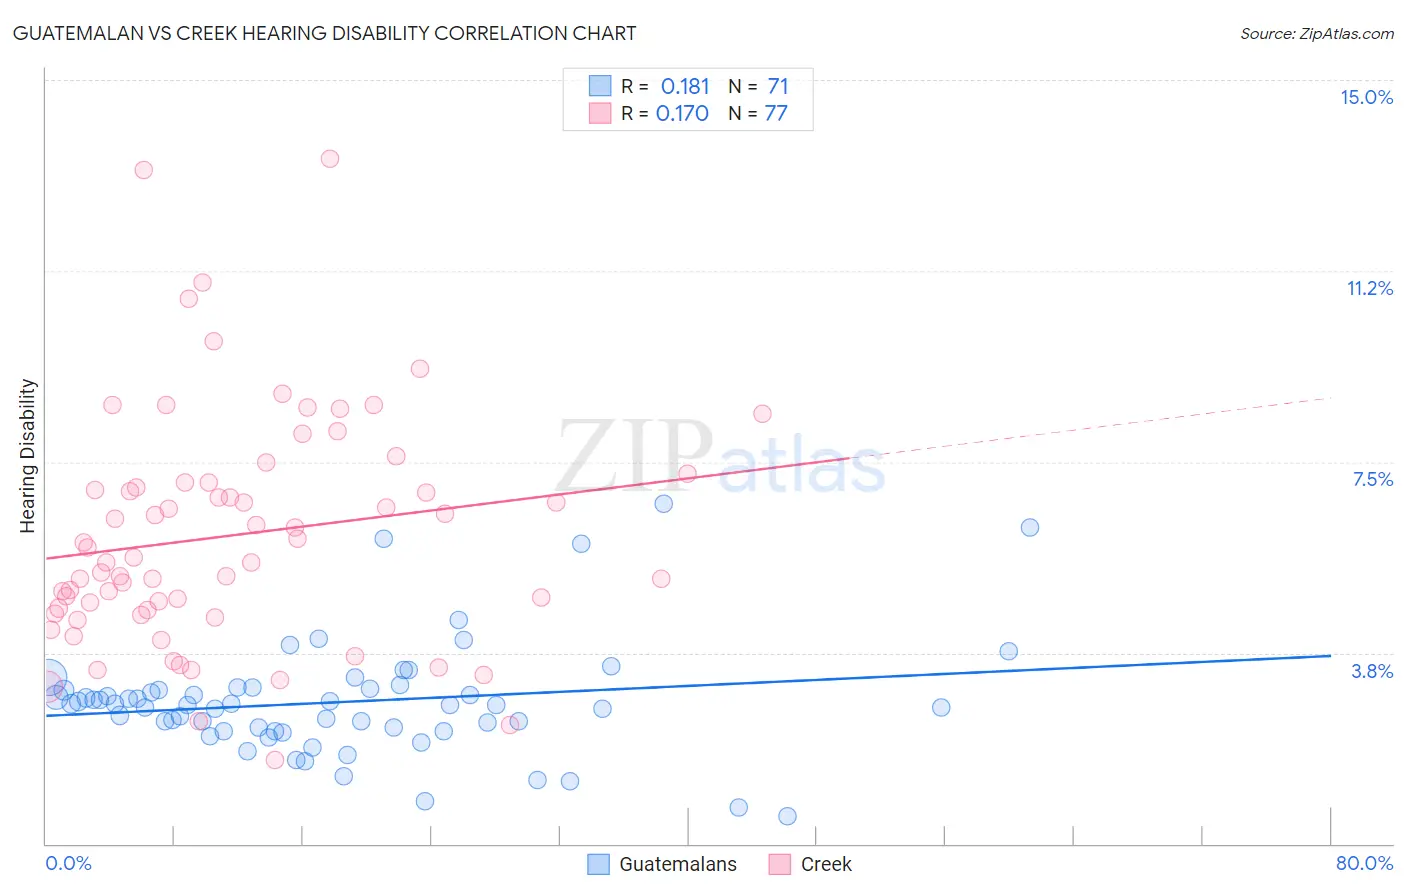
Guatemalan vs Creek Hearing Disability Correlation Chart
The statistical analysis conducted on geographies consisting of 409,374,057 people shows a poor positive correlation between the proportion of Guatemalans and percentage of population with hearing disability in the United States with a correlation coefficient (R) of 0.181 and weighted average of 2.8%. Similarly, the statistical analysis conducted on geographies consisting of 178,433,224 people shows a poor positive correlation between the proportion of Creek and percentage of population with hearing disability in the United States with a correlation coefficient (R) of 0.170 and weighted average of 4.4%, a difference of 55.4%.
Hearing Disability Correlation Summary
| Measurement | Guatemalan | Creek |
| Minimum | 0.55% | 1.6% |
| Maximum | 6.7% | 13.4% |
| Range | 6.1% | 11.8% |
| Mean | 2.8% | 6.1% |
| Median | 2.7% | 5.6% |
| Interquartile 25% (IQ1) | 2.2% | 4.6% |
| Interquartile 75% (IQ3) | 3.0% | 7.1% |
| Interquartile Range (IQR) | 0.81% | 2.5% |
| Standard Deviation (Sample) | 1.1% | 2.3% |
| Standard Deviation (Population) | 1.1% | 2.3% |
Similar Demographics by Hearing Disability
Demographics Similar to Guatemalans by Hearing Disability
In terms of hearing disability, the demographic groups most similar to Guatemalans are Turkish (2.8%, a difference of 0.070%), Honduran (2.8%, a difference of 0.080%), Immigrants from Chile (2.8%, a difference of 0.080%), Cypriot (2.8%, a difference of 0.12%), and Immigrants from Yemen (2.8%, a difference of 0.17%).
| Demographics | Rating | Rank | Hearing Disability |
| Immigrants | Spain | 94.9 /100 | #101 | Exceptional 2.8% |
| Taiwanese | 94.8 /100 | #102 | Exceptional 2.8% |
| Immigrants | Indonesia | 94.7 /100 | #103 | Exceptional 2.8% |
| Burmese | 94.2 /100 | #104 | Exceptional 2.8% |
| Moroccans | 93.9 /100 | #105 | Exceptional 2.8% |
| Hondurans | 93.4 /100 | #106 | Exceptional 2.8% |
| Immigrants | Chile | 93.4 /100 | #107 | Exceptional 2.8% |
| Guatemalans | 93.2 /100 | #108 | Exceptional 2.8% |
| Turks | 93.0 /100 | #109 | Exceptional 2.8% |
| Cypriots | 92.9 /100 | #110 | Exceptional 2.8% |
| Immigrants | Yemen | 92.7 /100 | #111 | Exceptional 2.8% |
| U.S. Virgin Islanders | 92.5 /100 | #112 | Exceptional 2.8% |
| Immigrants | Belarus | 91.6 /100 | #113 | Exceptional 2.8% |
| Cambodians | 91.1 /100 | #114 | Exceptional 2.8% |
| Immigrants | Latin America | 90.5 /100 | #115 | Exceptional 2.8% |
Demographics Similar to Creek by Hearing Disability
In terms of hearing disability, the demographic groups most similar to Creek are Kiowa (4.3%, a difference of 0.71%), Aleut (4.3%, a difference of 2.0%), Chickasaw (4.5%, a difference of 2.5%), Dutch West Indian (4.3%, a difference of 2.6%), and Alaska Native (4.5%, a difference of 2.7%).
| Demographics | Rating | Rank | Hearing Disability |
| Crow | 0.0 /100 | #329 | Tragic 4.2% |
| Natives/Alaskans | 0.0 /100 | #330 | Tragic 4.2% |
| Cherokee | 0.0 /100 | #331 | Tragic 4.2% |
| Houma | 0.0 /100 | #332 | Tragic 4.2% |
| Dutch West Indians | 0.0 /100 | #333 | Tragic 4.3% |
| Aleuts | 0.0 /100 | #334 | Tragic 4.3% |
| Kiowa | 0.0 /100 | #335 | Tragic 4.3% |
| Creek | 0.0 /100 | #336 | Tragic 4.4% |
| Chickasaw | 0.0 /100 | #337 | Tragic 4.5% |
| Alaska Natives | 0.0 /100 | #338 | Tragic 4.5% |
| Choctaw | 0.0 /100 | #339 | Tragic 4.5% |
| Pueblo | 0.0 /100 | #340 | Tragic 4.6% |
| Navajo | 0.0 /100 | #341 | Tragic 4.6% |
| Tsimshian | 0.0 /100 | #342 | Tragic 4.7% |
| Inupiat | 0.0 /100 | #343 | Tragic 4.7% |