French Canadian vs Belizean Hearing Disability
COMPARE
French Canadian
Belizean
Hearing Disability
Hearing Disability Comparison
French Canadians
Belizeans
3.8%
HEARING DISABILITY
0.0/ 100
METRIC RATING
307th/ 347
METRIC RANK
2.8%
HEARING DISABILITY
96.6/ 100
METRIC RATING
89th/ 347
METRIC RANK
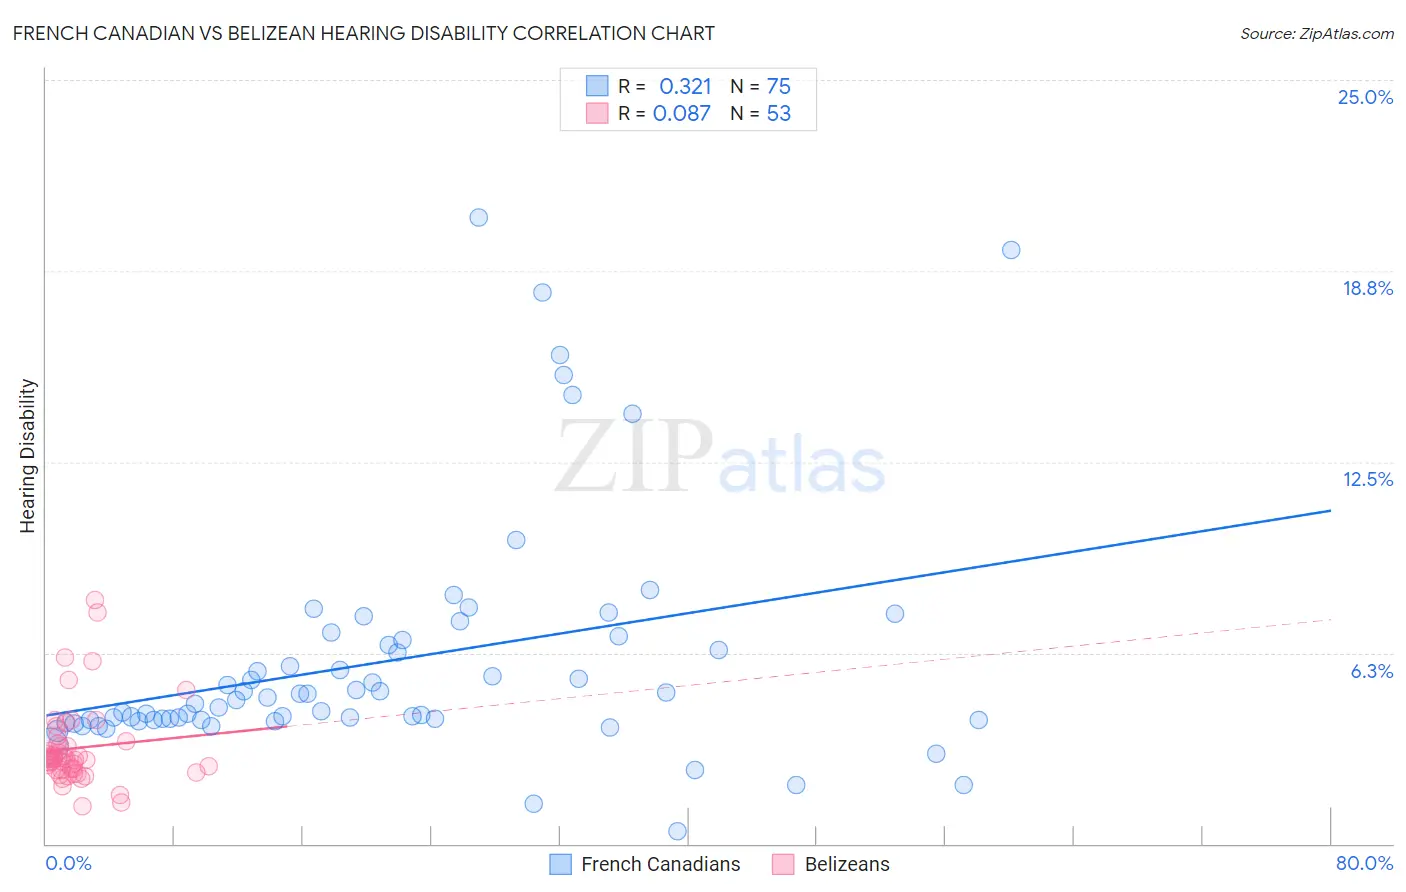
French Canadian vs Belizean Hearing Disability Correlation Chart
The statistical analysis conducted on geographies consisting of 502,335,766 people shows a mild positive correlation between the proportion of French Canadians and percentage of population with hearing disability in the United States with a correlation coefficient (R) of 0.321 and weighted average of 3.8%. Similarly, the statistical analysis conducted on geographies consisting of 144,164,730 people shows a slight positive correlation between the proportion of Belizeans and percentage of population with hearing disability in the United States with a correlation coefficient (R) of 0.087 and weighted average of 2.8%, a difference of 38.2%.
Hearing Disability Correlation Summary
| Measurement | French Canadian | Belizean |
| Minimum | 0.39% | 1.2% |
| Maximum | 20.5% | 8.0% |
| Range | 20.1% | 6.8% |
| Mean | 6.0% | 3.1% |
| Median | 4.7% | 2.8% |
| Interquartile 25% (IQ1) | 4.0% | 2.4% |
| Interquartile 75% (IQ3) | 6.7% | 3.3% |
| Interquartile Range (IQR) | 2.6% | 0.89% |
| Standard Deviation (Sample) | 3.9% | 1.4% |
| Standard Deviation (Population) | 3.9% | 1.3% |
Similar Demographics by Hearing Disability
Demographics Similar to French Canadians by Hearing Disability
In terms of hearing disability, the demographic groups most similar to French Canadians are Marshallese (3.8%, a difference of 0.12%), Ottawa (3.8%, a difference of 0.44%), Scotch-Irish (3.8%, a difference of 0.52%), Cree (3.8%, a difference of 0.83%), and English (3.8%, a difference of 0.98%).
| Demographics | Rating | Rank | Hearing Disability |
| Scottish | 0.0 /100 | #300 | Tragic 3.7% |
| Pennsylvania Germans | 0.0 /100 | #301 | Tragic 3.7% |
| Dutch | 0.0 /100 | #302 | Tragic 3.7% |
| Menominee | 0.0 /100 | #303 | Tragic 3.7% |
| French | 0.0 /100 | #304 | Tragic 3.8% |
| English | 0.0 /100 | #305 | Tragic 3.8% |
| Marshallese | 0.0 /100 | #306 | Tragic 3.8% |
| French Canadians | 0.0 /100 | #307 | Tragic 3.8% |
| Ottawa | 0.0 /100 | #308 | Tragic 3.8% |
| Scotch-Irish | 0.0 /100 | #309 | Tragic 3.8% |
| Cree | 0.0 /100 | #310 | Tragic 3.8% |
| Americans | 0.0 /100 | #311 | Tragic 3.9% |
| Cajuns | 0.0 /100 | #312 | Tragic 3.9% |
| Hopi | 0.0 /100 | #313 | Tragic 3.9% |
| Yakama | 0.0 /100 | #314 | Tragic 3.9% |
Demographics Similar to Belizeans by Hearing Disability
In terms of hearing disability, the demographic groups most similar to Belizeans are Immigrants from Turkey (2.8%, a difference of 0.030%), Immigrants from Morocco (2.8%, a difference of 0.030%), Somali (2.8%, a difference of 0.070%), Immigrants from Middle Africa (2.8%, a difference of 0.11%), and Iranian (2.8%, a difference of 0.14%).
| Demographics | Rating | Rank | Hearing Disability |
| Immigrants | Armenia | 97.2 /100 | #82 | Exceptional 2.7% |
| Immigrants | Cuba | 97.2 /100 | #83 | Exceptional 2.7% |
| Immigrants | Argentina | 97.0 /100 | #84 | Exceptional 2.8% |
| Immigrants | Northern Africa | 96.9 /100 | #85 | Exceptional 2.8% |
| Immigrants | Iran | 96.8 /100 | #86 | Exceptional 2.8% |
| Somalis | 96.7 /100 | #87 | Exceptional 2.8% |
| Immigrants | Turkey | 96.7 /100 | #88 | Exceptional 2.8% |
| Belizeans | 96.6 /100 | #89 | Exceptional 2.8% |
| Immigrants | Morocco | 96.6 /100 | #90 | Exceptional 2.8% |
| Immigrants | Middle Africa | 96.5 /100 | #91 | Exceptional 2.8% |
| Iranians | 96.4 /100 | #92 | Exceptional 2.8% |
| Immigrants | Kuwait | 96.3 /100 | #93 | Exceptional 2.8% |
| Uruguayans | 95.9 /100 | #94 | Exceptional 2.8% |
| Israelis | 95.9 /100 | #95 | Exceptional 2.8% |
| Immigrants | Somalia | 95.5 /100 | #96 | Exceptional 2.8% |