French American Indian vs Laotian Cognitive Disability
COMPARE
French American Indian
Laotian
Cognitive Disability
Cognitive Disability Comparison
French American Indians
Laotians
17.9%
COGNITIVE DISABILITY
0.7/ 100
METRIC RATING
248th/ 347
METRIC RANK
17.3%
COGNITIVE DISABILITY
50.0/ 100
METRIC RATING
174th/ 347
METRIC RANK
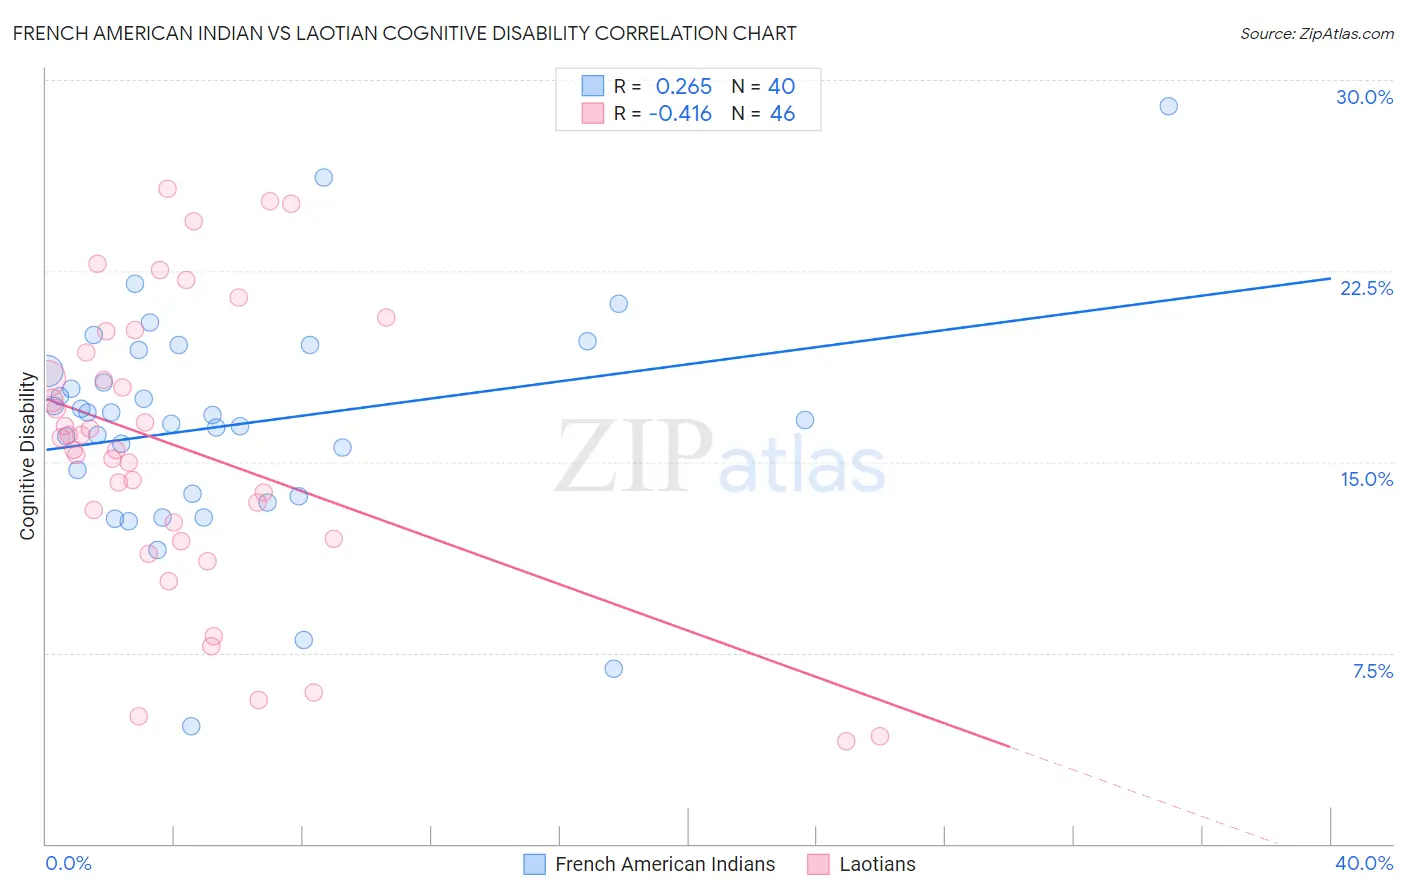
French American Indian vs Laotian Cognitive Disability Correlation Chart
The statistical analysis conducted on geographies consisting of 131,963,087 people shows a weak positive correlation between the proportion of French American Indians and percentage of population with cognitive disability in the United States with a correlation coefficient (R) of 0.265 and weighted average of 17.9%. Similarly, the statistical analysis conducted on geographies consisting of 224,855,635 people shows a moderate negative correlation between the proportion of Laotians and percentage of population with cognitive disability in the United States with a correlation coefficient (R) of -0.416 and weighted average of 17.3%, a difference of 3.5%.
Cognitive Disability Correlation Summary
| Measurement | French American Indian | Laotian |
| Minimum | 4.6% | 4.0% |
| Maximum | 28.9% | 25.7% |
| Range | 24.3% | 21.7% |
| Mean | 16.5% | 15.5% |
| Median | 16.7% | 15.7% |
| Interquartile 25% (IQ1) | 13.7% | 12.0% |
| Interquartile 75% (IQ3) | 19.0% | 19.3% |
| Interquartile Range (IQR) | 5.3% | 7.3% |
| Standard Deviation (Sample) | 4.5% | 5.7% |
| Standard Deviation (Population) | 4.5% | 5.6% |
Similar Demographics by Cognitive Disability
Demographics Similar to French American Indians by Cognitive Disability
In terms of cognitive disability, the demographic groups most similar to French American Indians are Samoan (17.9%, a difference of 0.010%), Cree (17.9%, a difference of 0.050%), Immigrants from Ethiopia (17.9%, a difference of 0.050%), Malaysian (17.9%, a difference of 0.060%), and Immigrants from Grenada (17.9%, a difference of 0.070%).
| Demographics | Rating | Rank | Cognitive Disability |
| Mexicans | 1.1 /100 | #241 | Tragic 17.8% |
| Paiute | 1.1 /100 | #242 | Tragic 17.8% |
| Immigrants | Bangladesh | 1.0 /100 | #243 | Tragic 17.8% |
| Jamaicans | 0.9 /100 | #244 | Tragic 17.9% |
| Trinidadians and Tobagonians | 0.8 /100 | #245 | Tragic 17.9% |
| Immigrants | Thailand | 0.8 /100 | #246 | Tragic 17.9% |
| Samoans | 0.7 /100 | #247 | Tragic 17.9% |
| French American Indians | 0.7 /100 | #248 | Tragic 17.9% |
| Cree | 0.7 /100 | #249 | Tragic 17.9% |
| Immigrants | Ethiopia | 0.7 /100 | #250 | Tragic 17.9% |
| Malaysians | 0.6 /100 | #251 | Tragic 17.9% |
| Immigrants | Grenada | 0.6 /100 | #252 | Tragic 17.9% |
| Hopi | 0.6 /100 | #253 | Tragic 17.9% |
| Hispanics or Latinos | 0.6 /100 | #254 | Tragic 17.9% |
| Immigrants | Azores | 0.6 /100 | #255 | Tragic 17.9% |
Demographics Similar to Laotians by Cognitive Disability
In terms of cognitive disability, the demographic groups most similar to Laotians are Immigrants from Northern Africa (17.3%, a difference of 0.010%), Tsimshian (17.3%, a difference of 0.010%), Shoshone (17.3%, a difference of 0.020%), Ute (17.3%, a difference of 0.030%), and Spanish (17.3%, a difference of 0.030%).
| Demographics | Rating | Rank | Cognitive Disability |
| Immigrants | Syria | 63.5 /100 | #167 | Good 17.2% |
| Immigrants | Immigrants | 62.5 /100 | #168 | Good 17.2% |
| Immigrants | Portugal | 61.8 /100 | #169 | Good 17.2% |
| Ecuadorians | 59.6 /100 | #170 | Average 17.2% |
| Tlingit-Haida | 59.4 /100 | #171 | Average 17.2% |
| Immigrants | Turkey | 56.7 /100 | #172 | Average 17.2% |
| Immigrants | Northern Africa | 50.2 /100 | #173 | Average 17.3% |
| Laotians | 50.0 /100 | #174 | Average 17.3% |
| Tsimshian | 49.8 /100 | #175 | Average 17.3% |
| Shoshone | 49.2 /100 | #176 | Average 17.3% |
| Ute | 49.1 /100 | #177 | Average 17.3% |
| Spanish | 48.9 /100 | #178 | Average 17.3% |
| Sioux | 48.6 /100 | #179 | Average 17.3% |
| Pakistanis | 43.9 /100 | #180 | Average 17.3% |
| Immigrants | Guyana | 42.9 /100 | #181 | Average 17.3% |