Finnish vs Delaware Disability Age Over 75
COMPARE
Finnish
Delaware
Disability Age Over 75
Disability Age Over 75 Comparison
Finns
Delaware
46.3%
DISABILITY AGE OVER 75
97.9/ 100
METRIC RATING
97th/ 347
METRIC RANK
47.5%
DISABILITY AGE OVER 75
39.1/ 100
METRIC RATING
183rd/ 347
METRIC RANK
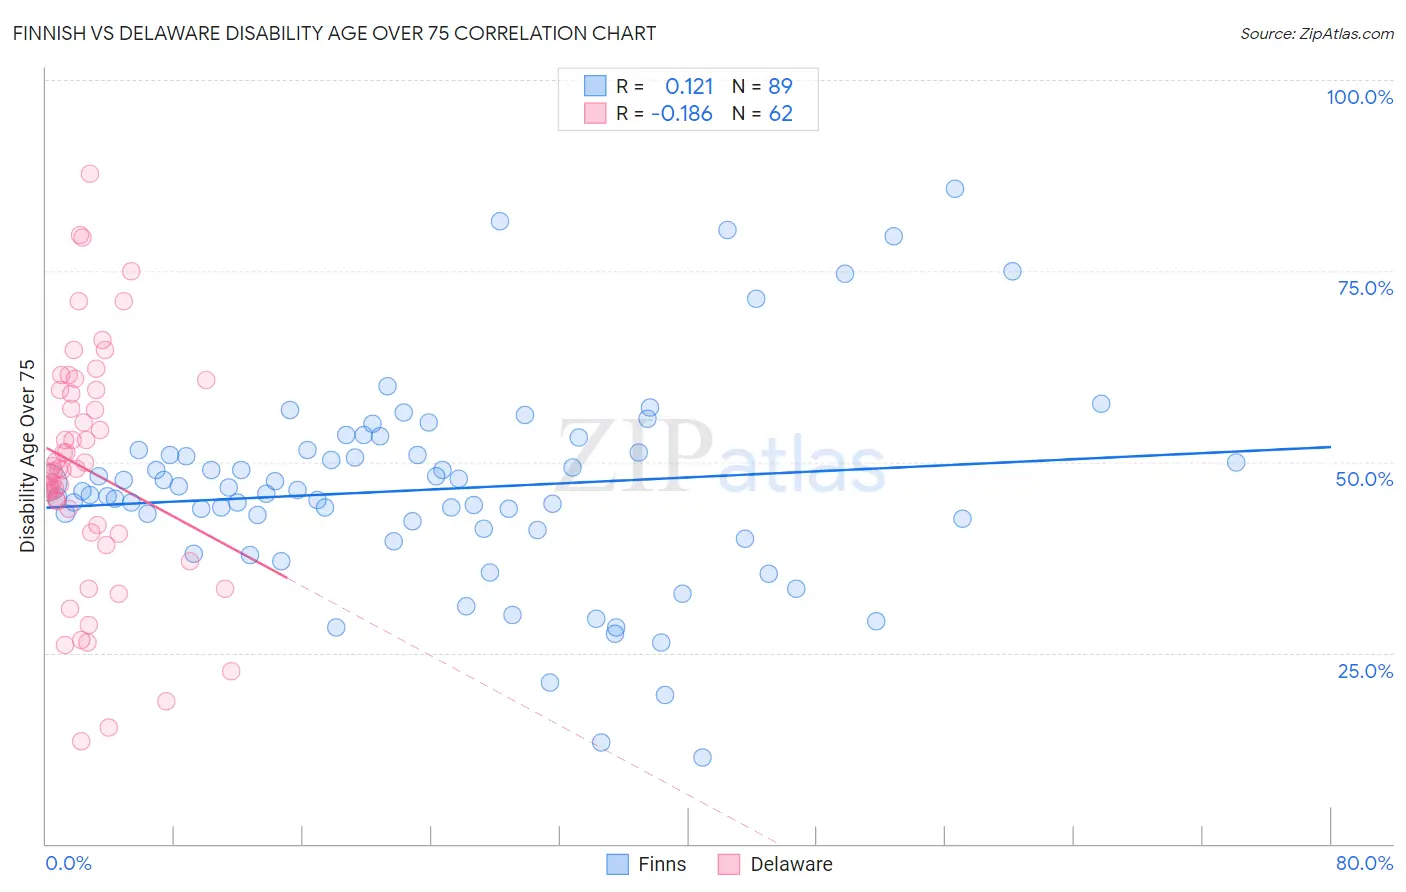
Finnish vs Delaware Disability Age Over 75 Correlation Chart
The statistical analysis conducted on geographies consisting of 404,104,832 people shows a poor positive correlation between the proportion of Finns and percentage of population with a disability over the age of 75 in the United States with a correlation coefficient (R) of 0.121 and weighted average of 46.3%. Similarly, the statistical analysis conducted on geographies consisting of 96,205,722 people shows a poor negative correlation between the proportion of Delaware and percentage of population with a disability over the age of 75 in the United States with a correlation coefficient (R) of -0.186 and weighted average of 47.5%, a difference of 2.5%.
Disability Age Over 75 Correlation Summary
| Measurement | Finnish | Delaware |
| Minimum | 11.3% | 13.3% |
| Maximum | 85.7% | 87.7% |
| Range | 74.4% | 74.4% |
| Mean | 46.4% | 49.0% |
| Median | 46.1% | 49.0% |
| Interquartile 25% (IQ1) | 41.1% | 40.8% |
| Interquartile 75% (IQ3) | 51.3% | 59.4% |
| Interquartile Range (IQR) | 10.2% | 18.6% |
| Standard Deviation (Sample) | 13.5% | 15.5% |
| Standard Deviation (Population) | 13.4% | 15.4% |
Similar Demographics by Disability Age Over 75
Demographics Similar to Finns by Disability Age Over 75
In terms of disability age over 75, the demographic groups most similar to Finns are Immigrants from Japan (46.3%, a difference of 0.010%), Immigrants from China (46.3%, a difference of 0.020%), Immigrants from Brazil (46.3%, a difference of 0.030%), Albanian (46.3%, a difference of 0.050%), and Palestinian (46.3%, a difference of 0.050%).
| Demographics | Rating | Rank | Disability Age Over 75 |
| Northern Europeans | 98.3 /100 | #90 | Exceptional 46.3% |
| Immigrants | Egypt | 98.3 /100 | #91 | Exceptional 46.3% |
| Germans | 98.2 /100 | #92 | Exceptional 46.3% |
| Ugandans | 98.2 /100 | #93 | Exceptional 46.3% |
| Albanians | 98.1 /100 | #94 | Exceptional 46.3% |
| Immigrants | Brazil | 98.0 /100 | #95 | Exceptional 46.3% |
| Immigrants | China | 98.0 /100 | #96 | Exceptional 46.3% |
| Finns | 97.9 /100 | #97 | Exceptional 46.3% |
| Immigrants | Japan | 97.8 /100 | #98 | Exceptional 46.3% |
| Palestinians | 97.7 /100 | #99 | Exceptional 46.3% |
| Immigrants | Eastern Europe | 97.7 /100 | #100 | Exceptional 46.3% |
| Mongolians | 97.7 /100 | #101 | Exceptional 46.3% |
| Immigrants | Malaysia | 97.1 /100 | #102 | Exceptional 46.4% |
| Ukrainians | 97.1 /100 | #103 | Exceptional 46.4% |
| Israelis | 97.0 /100 | #104 | Exceptional 46.4% |
Demographics Similar to Delaware by Disability Age Over 75
In terms of disability age over 75, the demographic groups most similar to Delaware are Immigrants from Moldova (47.4%, a difference of 0.020%), Immigrants from Kazakhstan (47.4%, a difference of 0.030%), Sierra Leonean (47.4%, a difference of 0.060%), Immigrants from Ecuador (47.4%, a difference of 0.060%), and Cuban (47.4%, a difference of 0.070%).
| Demographics | Rating | Rank | Disability Age Over 75 |
| Ecuadorians | 46.7 /100 | #176 | Average 47.4% |
| Haitians | 44.6 /100 | #177 | Average 47.4% |
| Cubans | 42.1 /100 | #178 | Average 47.4% |
| Sierra Leoneans | 41.7 /100 | #179 | Average 47.4% |
| Immigrants | Ecuador | 41.7 /100 | #180 | Average 47.4% |
| Immigrants | Kazakhstan | 40.4 /100 | #181 | Average 47.4% |
| Immigrants | Moldova | 39.9 /100 | #182 | Fair 47.4% |
| Delaware | 39.1 /100 | #183 | Fair 47.5% |
| Immigrants | Nigeria | 34.0 /100 | #184 | Fair 47.5% |
| Ghanaians | 33.0 /100 | #185 | Fair 47.5% |
| Sudanese | 32.0 /100 | #186 | Fair 47.5% |
| Immigrants | Sudan | 31.8 /100 | #187 | Fair 47.5% |
| Basques | 30.9 /100 | #188 | Fair 47.6% |
| Immigrants | Kenya | 30.8 /100 | #189 | Fair 47.6% |
| Somalis | 29.5 /100 | #190 | Fair 47.6% |