Filipino vs Scotch-Irish Vision Disability
COMPARE
Filipino
Scotch-Irish
Vision Disability
Vision Disability Comparison
Filipinos
Scotch-Irish
1.7%
VISION DISABILITY
100.0/ 100
METRIC RATING
2nd/ 347
METRIC RANK
2.4%
VISION DISABILITY
0.0/ 100
METRIC RATING
276th/ 347
METRIC RANK
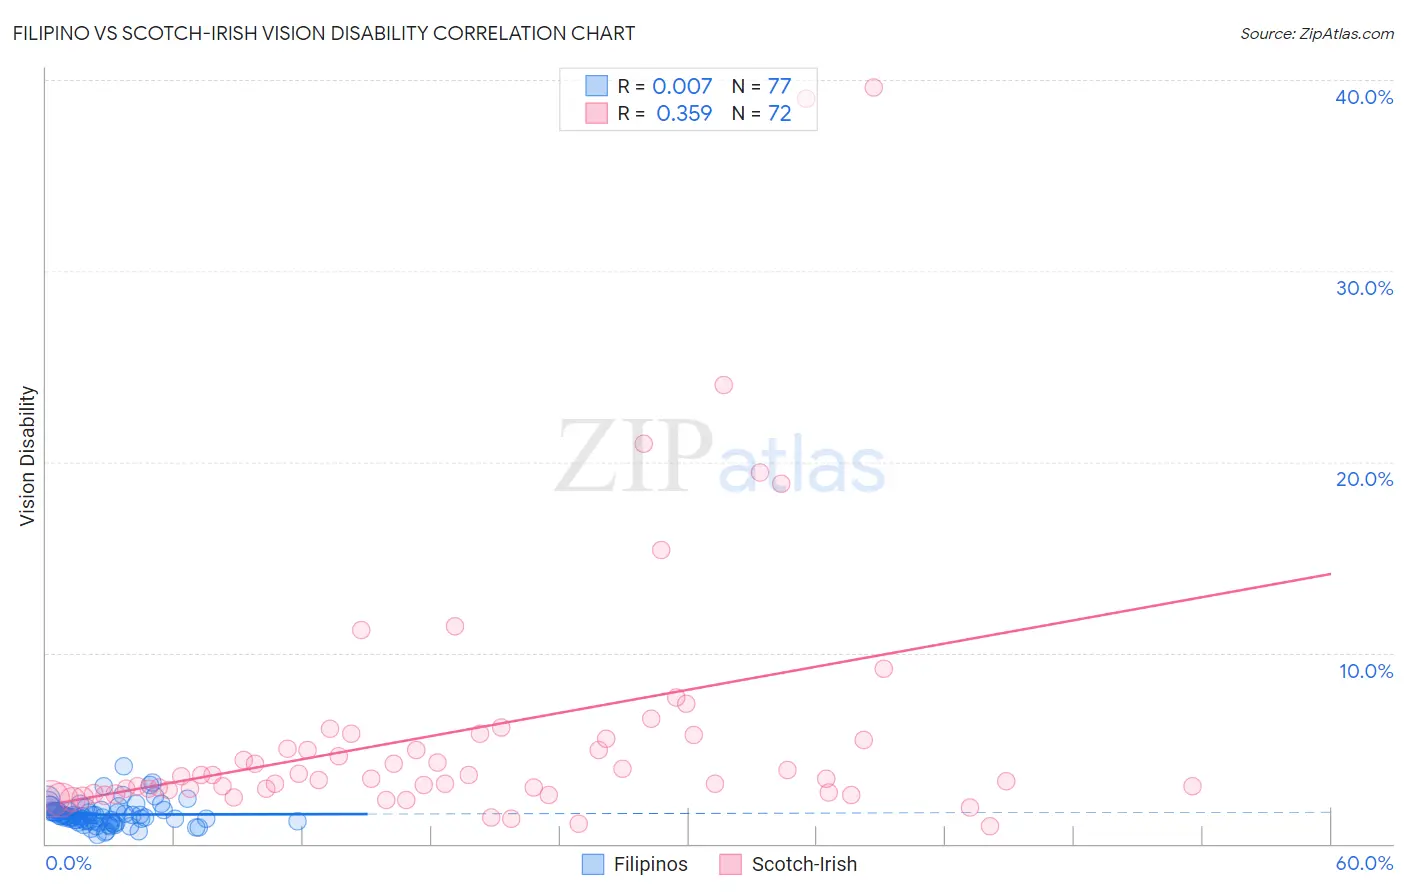
Filipino vs Scotch-Irish Vision Disability Correlation Chart
The statistical analysis conducted on geographies consisting of 254,226,053 people shows no correlation between the proportion of Filipinos and percentage of population with vision disability in the United States with a correlation coefficient (R) of 0.007 and weighted average of 1.7%. Similarly, the statistical analysis conducted on geographies consisting of 547,366,805 people shows a mild positive correlation between the proportion of Scotch-Irish and percentage of population with vision disability in the United States with a correlation coefficient (R) of 0.359 and weighted average of 2.4%, a difference of 44.8%.
Vision Disability Correlation Summary
| Measurement | Filipino | Scotch-Irish |
| Minimum | 0.48% | 0.89% |
| Maximum | 4.1% | 39.6% |
| Range | 3.6% | 38.7% |
| Mean | 1.5% | 6.0% |
| Median | 1.4% | 3.5% |
| Interquartile 25% (IQ1) | 1.2% | 2.7% |
| Interquartile 75% (IQ3) | 1.7% | 5.6% |
| Interquartile Range (IQR) | 0.53% | 2.9% |
| Standard Deviation (Sample) | 0.61% | 7.3% |
| Standard Deviation (Population) | 0.61% | 7.2% |
Similar Demographics by Vision Disability
Demographics Similar to Filipinos by Vision Disability
In terms of vision disability, the demographic groups most similar to Filipinos are Immigrants from India (1.7%, a difference of 0.050%), Immigrants from Taiwan (1.7%, a difference of 0.65%), Thai (1.7%, a difference of 3.3%), Okinawan (1.8%, a difference of 5.3%), and Immigrants from Iran (1.8%, a difference of 5.9%).
| Demographics | Rating | Rank | Vision Disability |
| Immigrants | India | 100.0 /100 | #1 | Exceptional 1.7% |
| Filipinos | 100.0 /100 | #2 | Exceptional 1.7% |
| Immigrants | Taiwan | 100.0 /100 | #3 | Exceptional 1.7% |
| Thais | 100.0 /100 | #4 | Exceptional 1.7% |
| Okinawans | 100.0 /100 | #5 | Exceptional 1.8% |
| Immigrants | Iran | 100.0 /100 | #6 | Exceptional 1.8% |
| Immigrants | South Central Asia | 100.0 /100 | #7 | Exceptional 1.8% |
| Iranians | 100.0 /100 | #8 | Exceptional 1.8% |
| Immigrants | Singapore | 100.0 /100 | #9 | Exceptional 1.8% |
| Immigrants | Hong Kong | 100.0 /100 | #10 | Exceptional 1.8% |
| Immigrants | Israel | 100.0 /100 | #11 | Exceptional 1.8% |
| Immigrants | Korea | 100.0 /100 | #12 | Exceptional 1.8% |
| Immigrants | Eastern Asia | 100.0 /100 | #13 | Exceptional 1.8% |
| Immigrants | China | 100.0 /100 | #14 | Exceptional 1.8% |
| Immigrants | Bolivia | 100.0 /100 | #15 | Exceptional 1.8% |
Demographics Similar to Scotch-Irish by Vision Disability
In terms of vision disability, the demographic groups most similar to Scotch-Irish are Bahamian (2.4%, a difference of 0.040%), Chippewa (2.4%, a difference of 0.090%), Spanish (2.4%, a difference of 0.20%), Nepalese (2.4%, a difference of 0.21%), and Cape Verdean (2.4%, a difference of 0.25%).
| Demographics | Rating | Rank | Vision Disability |
| Celtics | 0.1 /100 | #269 | Tragic 2.4% |
| Cubans | 0.1 /100 | #270 | Tragic 2.4% |
| Immigrants | Azores | 0.1 /100 | #271 | Tragic 2.4% |
| Spaniards | 0.1 /100 | #272 | Tragic 2.4% |
| Immigrants | Bahamas | 0.1 /100 | #273 | Tragic 2.4% |
| Immigrants | Latin America | 0.0 /100 | #274 | Tragic 2.4% |
| Chippewa | 0.0 /100 | #275 | Tragic 2.4% |
| Scotch-Irish | 0.0 /100 | #276 | Tragic 2.4% |
| Bahamians | 0.0 /100 | #277 | Tragic 2.4% |
| Spanish | 0.0 /100 | #278 | Tragic 2.4% |
| Nepalese | 0.0 /100 | #279 | Tragic 2.4% |
| Cape Verdeans | 0.0 /100 | #280 | Tragic 2.4% |
| U.S. Virgin Islanders | 0.0 /100 | #281 | Tragic 2.5% |
| Immigrants | Caribbean | 0.0 /100 | #282 | Tragic 2.5% |
| Puget Sound Salish | 0.0 /100 | #283 | Tragic 2.5% |