Fijian vs Spanish American Indian Vision Disability
COMPARE
Fijian
Spanish American Indian
Vision Disability
Vision Disability Comparison
Fijians
Spanish American Indians
2.4%
VISION DISABILITY
0.1/ 100
METRIC RATING
261st/ 347
METRIC RANK
2.6%
VISION DISABILITY
0.0/ 100
METRIC RATING
302nd/ 347
METRIC RANK
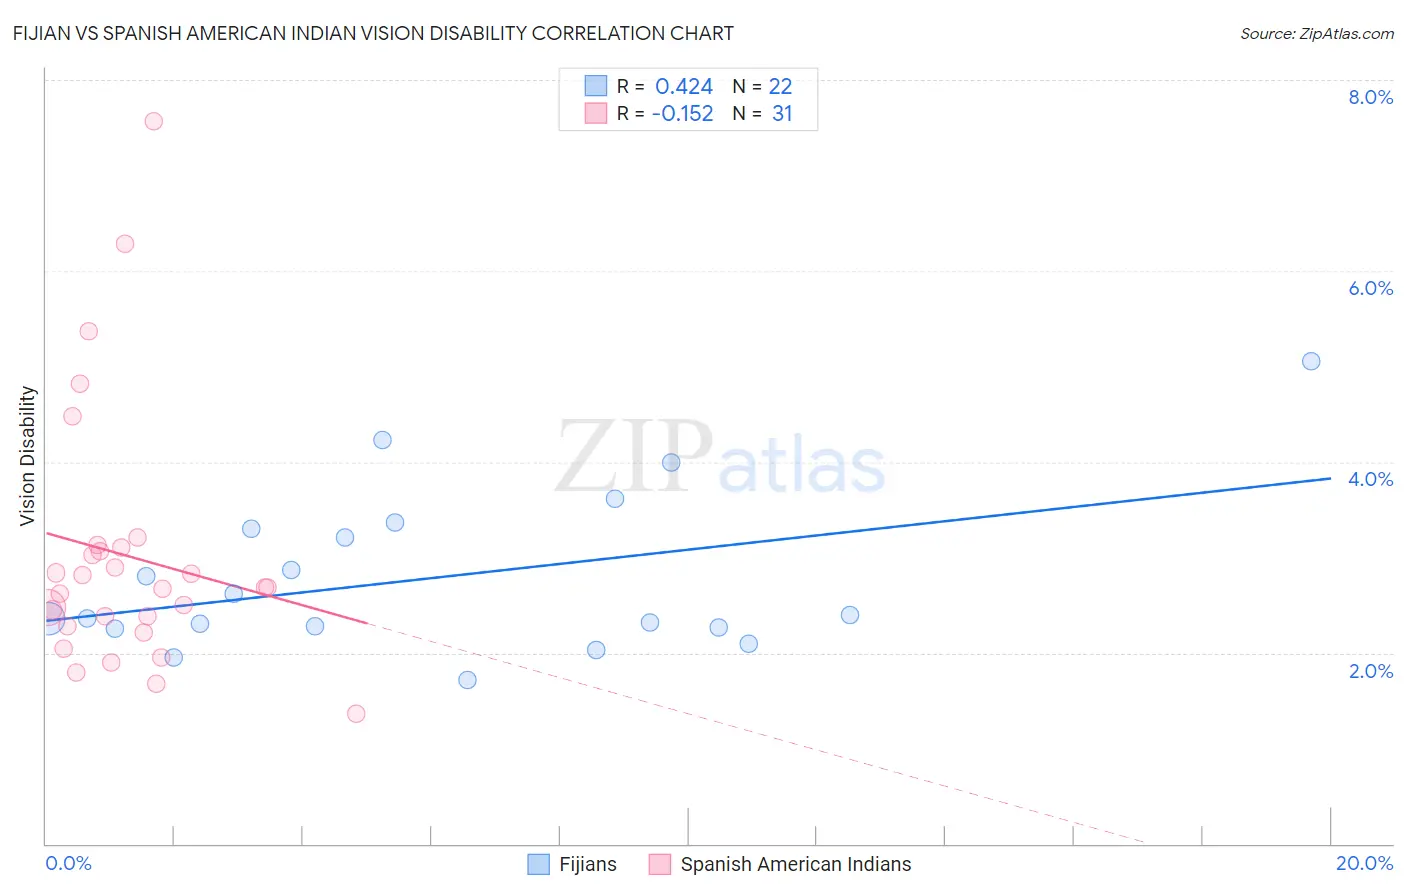
Fijian vs Spanish American Indian Vision Disability Correlation Chart
The statistical analysis conducted on geographies consisting of 55,940,410 people shows a moderate positive correlation between the proportion of Fijians and percentage of population with vision disability in the United States with a correlation coefficient (R) of 0.424 and weighted average of 2.4%. Similarly, the statistical analysis conducted on geographies consisting of 73,139,159 people shows a poor negative correlation between the proportion of Spanish American Indians and percentage of population with vision disability in the United States with a correlation coefficient (R) of -0.152 and weighted average of 2.6%, a difference of 7.8%.
Vision Disability Correlation Summary
| Measurement | Fijian | Spanish American Indian |
| Minimum | 1.7% | 1.4% |
| Maximum | 5.1% | 7.6% |
| Range | 3.3% | 6.2% |
| Mean | 2.8% | 3.0% |
| Median | 2.4% | 2.7% |
| Interquartile 25% (IQ1) | 2.3% | 2.3% |
| Interquartile 75% (IQ3) | 3.3% | 3.1% |
| Interquartile Range (IQR) | 1.0% | 0.83% |
| Standard Deviation (Sample) | 0.84% | 1.4% |
| Standard Deviation (Population) | 0.82% | 1.3% |
Similar Demographics by Vision Disability
Demographics Similar to Fijians by Vision Disability
In terms of vision disability, the demographic groups most similar to Fijians are Jamaican (2.4%, a difference of 0.030%), Belizean (2.4%, a difference of 0.21%), Immigrants from Belize (2.4%, a difference of 0.28%), White/Caucasian (2.4%, a difference of 0.38%), and British West Indian (2.4%, a difference of 0.40%).
| Demographics | Rating | Rank | Vision Disability |
| Haitians | 0.3 /100 | #254 | Tragic 2.4% |
| Immigrants | Guatemala | 0.3 /100 | #255 | Tragic 2.4% |
| Immigrants | Haiti | 0.2 /100 | #256 | Tragic 2.4% |
| West Indians | 0.2 /100 | #257 | Tragic 2.4% |
| British West Indians | 0.2 /100 | #258 | Tragic 2.4% |
| Whites/Caucasians | 0.2 /100 | #259 | Tragic 2.4% |
| Belizeans | 0.2 /100 | #260 | Tragic 2.4% |
| Fijians | 0.1 /100 | #261 | Tragic 2.4% |
| Jamaicans | 0.1 /100 | #262 | Tragic 2.4% |
| Immigrants | Belize | 0.1 /100 | #263 | Tragic 2.4% |
| Immigrants | Liberia | 0.1 /100 | #264 | Tragic 2.4% |
| Immigrants | Jamaica | 0.1 /100 | #265 | Tragic 2.4% |
| Mexican American Indians | 0.1 /100 | #266 | Tragic 2.4% |
| Ute | 0.1 /100 | #267 | Tragic 2.4% |
| Senegalese | 0.1 /100 | #268 | Tragic 2.4% |
Demographics Similar to Spanish American Indians by Vision Disability
In terms of vision disability, the demographic groups most similar to Spanish American Indians are Immigrants from Cabo Verde (2.6%, a difference of 0.22%), Aleut (2.6%, a difference of 0.36%), Hispanic or Latino (2.6%, a difference of 0.66%), Menominee (2.5%, a difference of 1.3%), and Iroquois (2.6%, a difference of 1.3%).
| Demographics | Rating | Rank | Vision Disability |
| Delaware | 0.0 /100 | #295 | Tragic 2.5% |
| Immigrants | Mexico | 0.0 /100 | #296 | Tragic 2.5% |
| Immigrants | Dominica | 0.0 /100 | #297 | Tragic 2.5% |
| Mexicans | 0.0 /100 | #298 | Tragic 2.5% |
| Cree | 0.0 /100 | #299 | Tragic 2.5% |
| Africans | 0.0 /100 | #300 | Tragic 2.5% |
| Menominee | 0.0 /100 | #301 | Tragic 2.5% |
| Spanish American Indians | 0.0 /100 | #302 | Tragic 2.6% |
| Immigrants | Cabo Verde | 0.0 /100 | #303 | Tragic 2.6% |
| Aleuts | 0.0 /100 | #304 | Tragic 2.6% |
| Hispanics or Latinos | 0.0 /100 | #305 | Tragic 2.6% |
| Iroquois | 0.0 /100 | #306 | Tragic 2.6% |
| Immigrants | Dominican Republic | 0.0 /100 | #307 | Tragic 2.6% |
| Arapaho | 0.0 /100 | #308 | Tragic 2.6% |
| Immigrants | Yemen | 0.0 /100 | #309 | Tragic 2.6% |