European vs Immigrants from Eastern Africa Disability Age Over 75

COMPARE

European
Race
Ancestry
AfghanAfricanAlaska NativeAlaskan AthabascanAlbanianAleutAlsatianAmericanApacheArabArapahoArgentineanArmenianAssyrian/Chaldean/SyriacAustralianAustrianBahamianBangladeshiBarbadianBasqueBelgianBelizeanBermudanBhutaneseBlackfeetBolivianBrazilianBritishBritish West IndianBulgarianBurmeseCajunCambodianCanadianCape VerdeanCarpatho RusynCelticCentral AmericanCentral American IndianCherokeeCheyenneChickasawChileanChineseChippewaChoctawColombianColvilleComancheCosta RicanCreeCreekCroatianCrowCubanCypriotCzechCzechoslovakianDanishDelawareDominicanDutchDutch West IndianEastern EuropeanEcuadorianEgyptianEnglishEstonianEthiopianEuropeanFijianFilipinoFinnishFrenchFrench American IndianFrench CanadianGermanGerman RussianGhanaianGreekGuamanian/ChamorroGuatemalanGuyaneseHaitianHmongHonduranHopiHoumaHungarianIcelanderIndian (Asian)IndonesianInupiatIranianIraqiIrishIroquoisIsraeliItalianJamaicanJapaneseJordanianKenyanKiowaKoreanLaotianLatvianLebaneseLiberianLithuanianLumbeeLuxembourgerMacedonianMalaysianMalteseMarshalleseMenomineeMexicanMexican American IndianMongolianMoroccanNative HawaiianNavajoNepaleseNew ZealanderNicaraguanNigerianNorthern EuropeanNorwegianOkinawanOsageOttawaPaiutePakistaniPalestinianPanamanianParaguayanPennsylvania GermanPeruvianPimaPolishPortuguesePotawatomiPuebloPuerto RicanPuget Sound SalishRomanianRussianSalvadoranSamoanScandinavianScotch-IrishScottishSeminoleSenegaleseSerbianShoshoneSierra LeoneanSiouxSlavicSlovakSloveneSomaliSouth AfricanSouth AmericanSouth American IndianSoviet UnionSpaniardSpanishSpanish AmericanSpanish American IndianSri LankanSubsaharan AfricanSudaneseSwedishSwissSyrianTaiwaneseThaiTlingit-HaidaTohono O'OdhamTonganTrinidadian and TobagonianTsimshianTurkishU.S. Virgin IslanderUgandanUkrainianUruguayanUteVenezuelanVietnameseWelshWest IndianYakamaYaquiYugoslavianYumanYup'ikZimbabwean
Immigration
NonimmigrantsImmigrantsAfghanistanAfricaAlbaniaArgentinaArmeniaAsiaAustraliaAustriaBahamasBangladeshBarbadosBelarusBelgiumBelizeBoliviaBosnia and HerzegovinaBrazilBulgariaBurma/MyanmarCabo VerdeCambodiaCameroonCanadaCaribbeanCentral AmericaChileChinaColombiaCongoCosta RicaCroatiaCubaCzechoslovakiaDenmarkDominicaDominican RepublicEastern AsiaEastern EuropeEcuadorEgyptEl SalvadorEnglandEritreaEthiopiaEuropeFijiFranceGermanyGhanaGreeceGrenadaGuatemalaGuyanaHaitiHondurasHong KongHungaryIndiaIndonesiaIranIraqIrelandIsraelItalyJamaicaJapanJordanKazakhstanKenyaKoreaKuwaitLaosLatin AmericaLatviaLebanonLiberiaLithuaniaMalaysiaMexicoMicronesiaMiddle AfricaMoldovaMoroccoNepalNetherlandsNicaraguaNigeriaNorth AmericaNorth MacedoniaNorthern AfricaNorthern EuropeNorwayOceaniaPakistanPanamaPeruPhilippinesPolandPortugalRomaniaRussiaSaudi ArabiaScotlandSenegalSerbiaSierra LeoneSingaporeSomaliaSouth AfricaSouth AmericaSouth Central AsiaSouth Eastern AsiaSouthern EuropeSpainSri LankaSt. Vincent and the GrenadinesSudanSwedenSwitzerlandSyriaTaiwanThailandTrinidad and TobagoTurkeyUgandaUkraineUruguayUzbekistanVenezuelaVietnamWest IndiesWestern AfricaWestern AsiaWestern EuropeYemenZaireZimbabweAzores
Immigrants from Eastern Africa
Race
Ancestry
AfghanAfricanAlaska NativeAlaskan AthabascanAlbanianAleutAlsatianAmericanApacheArabArapahoArgentineanArmenianAssyrian/Chaldean/SyriacAustralianAustrianBahamianBangladeshiBarbadianBasqueBelgianBelizeanBermudanBhutaneseBlackfeetBolivianBrazilianBritishBritish West IndianBulgarianBurmeseCajunCambodianCanadianCape VerdeanCarpatho RusynCelticCentral AmericanCentral American IndianCherokeeCheyenneChickasawChileanChineseChippewaChoctawColombianColvilleComancheCosta RicanCreeCreekCroatianCrowCubanCypriotCzechCzechoslovakianDanishDelawareDominicanDutchDutch West IndianEastern EuropeanEcuadorianEgyptianEnglishEstonianEthiopianFijianFilipinoFinnishFrenchFrench American IndianFrench CanadianGermanGerman RussianGhanaianGreekGuamanian/ChamorroGuatemalanGuyaneseHaitianHmongHonduranHopiHoumaHungarianIcelanderIndian (Asian)IndonesianInupiatIranianIraqiIrishIroquoisIsraeliItalianJamaicanJapaneseJordanianKenyanKiowaKoreanLaotianLatvianLebaneseLiberianLithuanianLumbeeLuxembourgerMacedonianMalaysianMalteseMarshalleseMenomineeMexicanMexican American IndianMongolianMoroccanNative HawaiianNavajoNepaleseNew ZealanderNicaraguanNigerianNorthern EuropeanNorwegianOkinawanOsageOttawaPaiutePakistaniPalestinianPanamanianParaguayanPennsylvania GermanPeruvianPimaPolishPortuguesePotawatomiPuebloPuerto RicanPuget Sound SalishRomanianRussianSalvadoranSamoanScandinavianScotch-IrishScottishSeminoleSenegaleseSerbianShoshoneSierra LeoneanSiouxSlavicSlovakSloveneSomaliSouth AfricanSouth AmericanSouth American IndianSoviet UnionSpaniardSpanishSpanish AmericanSpanish American IndianSri LankanSubsaharan AfricanSudaneseSwedishSwissSyrianTaiwaneseThaiTlingit-HaidaTohono O'OdhamTonganTrinidadian and TobagonianTsimshianTurkishU.S. Virgin IslanderUgandanUkrainianUruguayanUteVenezuelanVietnameseWelshWest IndianYakamaYaquiYugoslavianYumanYup'ikZimbabwean
Immigration
NonimmigrantsImmigrantsAfghanistanAfricaAlbaniaArgentinaArmeniaAsiaAustraliaAustriaBahamasBangladeshBarbadosBelarusBelgiumBelizeBoliviaBosnia and HerzegovinaBrazilBulgariaBurma/MyanmarCabo VerdeCambodiaCameroonCanadaCaribbeanCentral AmericaChileChinaColombiaCongoCosta RicaCroatiaCubaCzechoslovakiaDenmarkDominicaDominican RepublicEastern AfricaEastern AsiaEastern EuropeEcuadorEgyptEl SalvadorEnglandEritreaEthiopiaEuropeFijiFranceGermanyGhanaGreeceGrenadaGuatemalaGuyanaHaitiHondurasHong KongHungaryIndiaIndonesiaIranIraqIrelandIsraelItalyJamaicaJapanJordanKazakhstanKenyaKoreaKuwaitLaosLatin AmericaLatviaLebanonLiberiaLithuaniaMalaysiaMexicoMicronesiaMiddle AfricaMoldovaMoroccoNepalNetherlandsNicaraguaNigeriaNorth AmericaNorth MacedoniaNorthern AfricaNorthern EuropeNorwayOceaniaPakistanPanamaPeruPhilippinesPolandPortugalRomaniaRussiaSaudi ArabiaScotlandSenegalSerbiaSierra LeoneSingaporeSomaliaSouth AfricaSouth AmericaSouth Central AsiaSouth Eastern AsiaSouthern EuropeSpainSri LankaSt. Vincent and the GrenadinesSudanSwedenSwitzerlandSyriaTaiwanThailandTrinidad and TobagoTurkeyUgandaUkraineUruguayUzbekistanVenezuelaVietnamWest IndiesWestern AfricaWestern AsiaWestern EuropeYemenZaireZimbabweAzores
Disability Age Over 75
Income
Poverty
Unemployment
Labor Participation
Family Structure
Vehicle Availability
Education Level
Disability

Disability Age Over 75 Comparison

Europeans

Immigrants from Eastern Africa

Exceptional
Good
46.7%
DISABILITY AGE OVER 75
91.2/ 100
METRIC RATING
126th/ 347
METRIC RANK
47.2%
DISABILITY AGE OVER 75
65.5/ 100
METRIC RATING
163rd/ 347
METRIC RANK

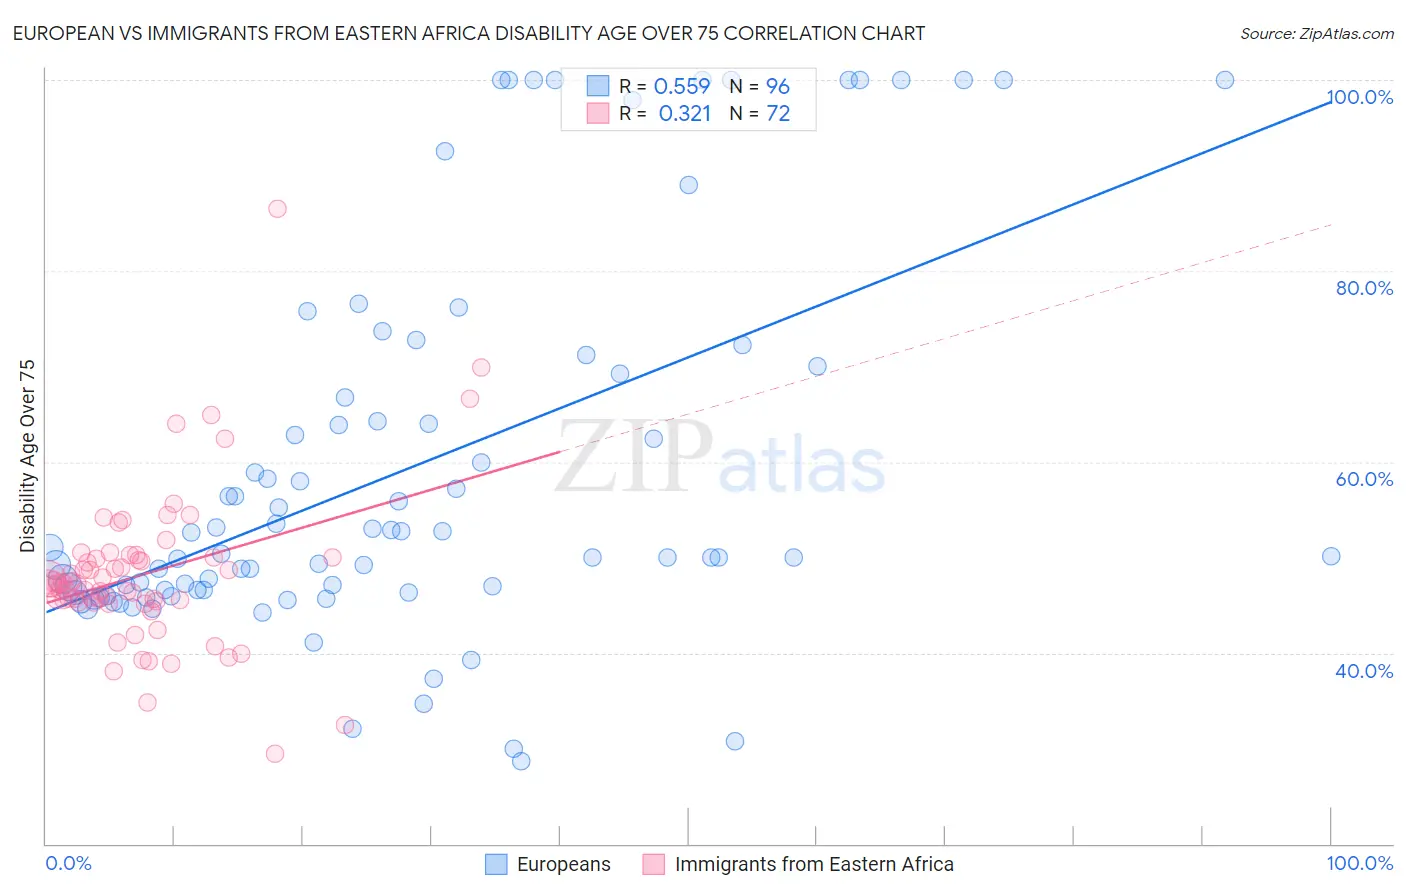
European vs Immigrants from Eastern Africa Disability Age Over 75 Correlation Chart

The statistical analysis conducted on geographies consisting of 559,923,693 people shows a substantial positive correlation between the proportion of Europeans and percentage of population with a disability over the age of 75 in the United States with a correlation coefficient (R) of 0.559 and weighted average of 46.7%. Similarly, the statistical analysis conducted on geographies consisting of 354,505,709 people shows a mild positive correlation between the proportion of Immigrants from Eastern Africa and percentage of population with a disability over the age of 75 in the United States with a correlation coefficient (R) of 0.321 and weighted average of 47.2%, a difference of 0.96%.
European vs Immigrants from Eastern Africa Disability Age Over 75

Disability Age Over 75 Correlation Summary

MeasurementEuropeanImmigrants from Eastern Africa
Minimum28.7%29.5%
Maximum100.0%86.5%
Range71.3%57.0%
Mean59.1%48.2%
Median50.2%47.2%
Interquartile 25% (IQ1)46.5%45.3%
Interquartile 75% (IQ3)68.0%50.0%
Interquartile Range (IQR)21.5%4.7%
Standard Deviation (Sample)19.7%8.3%
Standard Deviation (Population)19.6%8.2%

Similar Demographics by Disability Age Over 75

Demographics Similar to Europeans by Disability Age Over 75

In terms of disability age over 75, the demographic groups most similar to Europeans are Colombian (46.7%, a difference of 0.010%), Syrian (46.7%, a difference of 0.010%), Icelander (46.7%, a difference of 0.020%), Immigrants from Germany (46.7%, a difference of 0.030%), and Immigrants from South America (46.7%, a difference of 0.040%).
DemographicsRating | RankDisability Age Over 75
Canadians
94.4
/100
|
#119
Exceptional
46.6%
Immigrants | Nepal
94.1
/100
|
#120
Exceptional
46.6%
Scandinavians
93.6
/100
|
#121
Exceptional
46.6%
Immigrants | Albania
93.2
/100
|
#122
Exceptional
46.6%
Immigrants | Colombia
92.6
/100
|
#123
Exceptional
46.7%
Immigrants | South America
91.8
/100
|
#124
Exceptional
46.7%
Colombians
91.3
/100
|
#125
Exceptional
46.7%
Europeans
91.2
/100
|
#126
Exceptional
46.7%
Syrians
91.1
/100
|
#127
Exceptional
46.7%
Icelanders
90.9
/100
|
#128
Exceptional
46.7%
Immigrants | Germany
90.8
/100
|
#129
Exceptional
46.7%
Immigrants | Northern Africa
90.7
/100
|
#130
Exceptional
46.7%
Scottish
90.5
/100
|
#131
Exceptional
46.7%
South Americans
90.0
/100
|
#132
Excellent
46.8%
English
89.4
/100
|
#133
Excellent
46.8%

Demographics Similar to Immigrants from Eastern Africa by Disability Age Over 75

In terms of disability age over 75, the demographic groups most similar to Immigrants from Eastern Africa are Pennsylvania German (47.2%, a difference of 0.010%), French (47.2%, a difference of 0.020%), Immigrants from Zimbabwe (47.2%, a difference of 0.030%), Immigrants from Sierra Leone (47.2%, a difference of 0.030%), and Immigrants from Middle Africa (47.1%, a difference of 0.070%).
DemographicsRating | RankDisability Age Over 75
Arabs
73.3
/100
|
#156
Good
47.1%
Bhutanese
72.6
/100
|
#157
Good
47.1%
Immigrants | Guyana
71.9
/100
|
#158
Good
47.1%
Immigrants | Morocco
71.4
/100
|
#159
Good
47.1%
Immigrants | Middle Africa
68.3
/100
|
#160
Good
47.1%
South American Indians
68.1
/100
|
#161
Good
47.1%
Pennsylvania Germans
66.0
/100
|
#162
Good
47.2%
Immigrants | Eastern Africa
65.5
/100
|
#163
Good
47.2%
French
64.6
/100
|
#164
Good
47.2%
Immigrants | Zimbabwe
64.4
/100
|
#165
Good
47.2%
Immigrants | Sierra Leone
64.4
/100
|
#166
Good
47.2%
Moroccans
62.9
/100
|
#167
Good
47.2%
Kenyans
58.8
/100
|
#168
Average
47.2%
Celtics
58.7
/100
|
#169
Average
47.2%
German Russians
56.2
/100
|
#170
Average
47.3%