Ethiopian vs Blackfeet Disability Age Over 75

COMPARE

Ethiopian
Race
Ancestry
AfghanAfricanAlaska NativeAlaskan AthabascanAlbanianAleutAlsatianAmericanApacheArabArapahoArgentineanArmenianAssyrian/Chaldean/SyriacAustralianAustrianBahamianBangladeshiBarbadianBasqueBelgianBelizeanBermudanBhutaneseBolivianBrazilianBritishBritish West IndianBulgarianBurmeseCajunCambodianCanadianCape VerdeanCarpatho RusynCelticCentral AmericanCentral American IndianCherokeeCheyenneChickasawChileanChineseChippewaChoctawColombianColvilleComancheCosta RicanCreeCreekCroatianCrowCubanCypriotCzechCzechoslovakianDanishDelawareDominicanDutchDutch West IndianEastern EuropeanEcuadorianEgyptianEnglishEstonianEthiopianEuropeanFijianFilipinoFinnishFrenchFrench American IndianFrench CanadianGermanGerman RussianGhanaianGreekGuamanian/ChamorroGuatemalanGuyaneseHaitianHmongHonduranHopiHoumaHungarianIcelanderIndian (Asian)IndonesianInupiatIranianIraqiIrishIroquoisIsraeliItalianJamaicanJapaneseJordanianKenyanKiowaKoreanLaotianLatvianLebaneseLiberianLithuanianLumbeeLuxembourgerMacedonianMalaysianMalteseMarshalleseMenomineeMexicanMexican American IndianMongolianMoroccanNative HawaiianNavajoNepaleseNew ZealanderNicaraguanNigerianNorthern EuropeanNorwegianOkinawanOsageOttawaPaiutePakistaniPalestinianPanamanianParaguayanPennsylvania GermanPeruvianPimaPolishPortuguesePotawatomiPuebloPuerto RicanPuget Sound SalishRomanianRussianSalvadoranSamoanScandinavianScotch-IrishScottishSeminoleSenegaleseSerbianShoshoneSierra LeoneanSiouxSlavicSlovakSloveneSomaliSouth AfricanSouth AmericanSouth American IndianSoviet UnionSpaniardSpanishSpanish AmericanSpanish American IndianSri LankanSubsaharan AfricanSudaneseSwedishSwissSyrianTaiwaneseThaiTlingit-HaidaTohono O'OdhamTonganTrinidadian and TobagonianTsimshianTurkishU.S. Virgin IslanderUgandanUkrainianUruguayanUteVenezuelanVietnameseWelshWest IndianYakamaYaquiYugoslavianYumanYup'ikZimbabwean
Immigration
NonimmigrantsImmigrantsAfghanistanAfricaAlbaniaArgentinaArmeniaAsiaAustraliaAustriaBahamasBangladeshBarbadosBelarusBelgiumBelizeBoliviaBosnia and HerzegovinaBrazilBulgariaBurma/MyanmarCabo VerdeCambodiaCameroonCanadaCaribbeanCentral AmericaChileChinaColombiaCongoCosta RicaCroatiaCubaCzechoslovakiaDenmarkDominicaDominican RepublicEastern AfricaEastern AsiaEastern EuropeEcuadorEgyptEl SalvadorEnglandEritreaEthiopiaEuropeFijiFranceGermanyGhanaGreeceGrenadaGuatemalaGuyanaHaitiHondurasHong KongHungaryIndiaIndonesiaIranIraqIrelandIsraelItalyJamaicaJapanJordanKazakhstanKenyaKoreaKuwaitLaosLatin AmericaLatviaLebanonLiberiaLithuaniaMalaysiaMexicoMicronesiaMiddle AfricaMoldovaMoroccoNepalNetherlandsNicaraguaNigeriaNorth AmericaNorth MacedoniaNorthern AfricaNorthern EuropeNorwayOceaniaPakistanPanamaPeruPhilippinesPolandPortugalRomaniaRussiaSaudi ArabiaScotlandSenegalSerbiaSierra LeoneSingaporeSomaliaSouth AfricaSouth AmericaSouth Central AsiaSouth Eastern AsiaSouthern EuropeSpainSri LankaSt. Vincent and the GrenadinesSudanSwedenSwitzerlandSyriaTaiwanThailandTrinidad and TobagoTurkeyUgandaUkraineUruguayUzbekistanVenezuelaVietnamWest IndiesWestern AfricaWestern AsiaWestern EuropeYemenZaireZimbabweAzores
Blackfeet
Race
Ancestry
AfghanAfricanAlaska NativeAlaskan AthabascanAlbanianAleutAlsatianAmericanApacheArabArapahoArgentineanArmenianAssyrian/Chaldean/SyriacAustralianAustrianBahamianBangladeshiBarbadianBasqueBelgianBelizeanBermudanBhutaneseBlackfeetBolivianBrazilianBritishBritish West IndianBulgarianBurmeseCajunCambodianCanadianCape VerdeanCarpatho RusynCelticCentral AmericanCentral American IndianCherokeeCheyenneChickasawChileanChineseChippewaChoctawColombianColvilleComancheCosta RicanCreeCreekCroatianCrowCubanCypriotCzechCzechoslovakianDanishDelawareDominicanDutchDutch West IndianEastern EuropeanEcuadorianEgyptianEnglishEstonianEuropeanFijianFilipinoFinnishFrenchFrench American IndianFrench CanadianGermanGerman RussianGhanaianGreekGuamanian/ChamorroGuatemalanGuyaneseHaitianHmongHonduranHopiHoumaHungarianIcelanderIndian (Asian)IndonesianInupiatIranianIraqiIrishIroquoisIsraeliItalianJamaicanJapaneseJordanianKenyanKiowaKoreanLaotianLatvianLebaneseLiberianLithuanianLumbeeLuxembourgerMacedonianMalaysianMalteseMarshalleseMenomineeMexicanMexican American IndianMongolianMoroccanNative HawaiianNavajoNepaleseNew ZealanderNicaraguanNigerianNorthern EuropeanNorwegianOkinawanOsageOttawaPaiutePakistaniPalestinianPanamanianParaguayanPennsylvania GermanPeruvianPimaPolishPortuguesePotawatomiPuebloPuerto RicanPuget Sound SalishRomanianRussianSalvadoranSamoanScandinavianScotch-IrishScottishSeminoleSenegaleseSerbianShoshoneSierra LeoneanSiouxSlavicSlovakSloveneSomaliSouth AfricanSouth AmericanSouth American IndianSoviet UnionSpaniardSpanishSpanish AmericanSpanish American IndianSri LankanSubsaharan AfricanSudaneseSwedishSwissSyrianTaiwaneseThaiTlingit-HaidaTohono O'OdhamTonganTrinidadian and TobagonianTsimshianTurkishU.S. Virgin IslanderUgandanUkrainianUruguayanUteVenezuelanVietnameseWelshWest IndianYakamaYaquiYugoslavianYumanYup'ikZimbabwean
Immigration
NonimmigrantsImmigrantsAfghanistanAfricaAlbaniaArgentinaArmeniaAsiaAustraliaAustriaBahamasBangladeshBarbadosBelarusBelgiumBelizeBoliviaBosnia and HerzegovinaBrazilBulgariaBurma/MyanmarCabo VerdeCambodiaCameroonCanadaCaribbeanCentral AmericaChileChinaColombiaCongoCosta RicaCroatiaCubaCzechoslovakiaDenmarkDominicaDominican RepublicEastern AfricaEastern AsiaEastern EuropeEcuadorEgyptEl SalvadorEnglandEritreaEthiopiaEuropeFijiFranceGermanyGhanaGreeceGrenadaGuatemalaGuyanaHaitiHondurasHong KongHungaryIndiaIndonesiaIranIraqIrelandIsraelItalyJamaicaJapanJordanKazakhstanKenyaKoreaKuwaitLaosLatin AmericaLatviaLebanonLiberiaLithuaniaMalaysiaMexicoMicronesiaMiddle AfricaMoldovaMoroccoNepalNetherlandsNicaraguaNigeriaNorth AmericaNorth MacedoniaNorthern AfricaNorthern EuropeNorwayOceaniaPakistanPanamaPeruPhilippinesPolandPortugalRomaniaRussiaSaudi ArabiaScotlandSenegalSerbiaSierra LeoneSingaporeSomaliaSouth AfricaSouth AmericaSouth Central AsiaSouth Eastern AsiaSouthern EuropeSpainSri LankaSt. Vincent and the GrenadinesSudanSwedenSwitzerlandSyriaTaiwanThailandTrinidad and TobagoTurkeyUgandaUkraineUruguayUzbekistanVenezuelaVietnamWest IndiesWestern AfricaWestern AsiaWestern EuropeYemenZaireZimbabweAzores
Disability Age Over 75
Income
Poverty
Unemployment
Labor Participation
Family Structure
Vehicle Availability
Education Level
Disability

Disability Age Over 75 Comparison

Ethiopians

Blackfeet

Excellent
Tragic
46.8%
DISABILITY AGE OVER 75
88.9/ 100
METRIC RATING
135th/ 347
METRIC RANK
48.8%
DISABILITY AGE OVER 75
0.5/ 100
METRIC RATING
257th/ 347
METRIC RANK

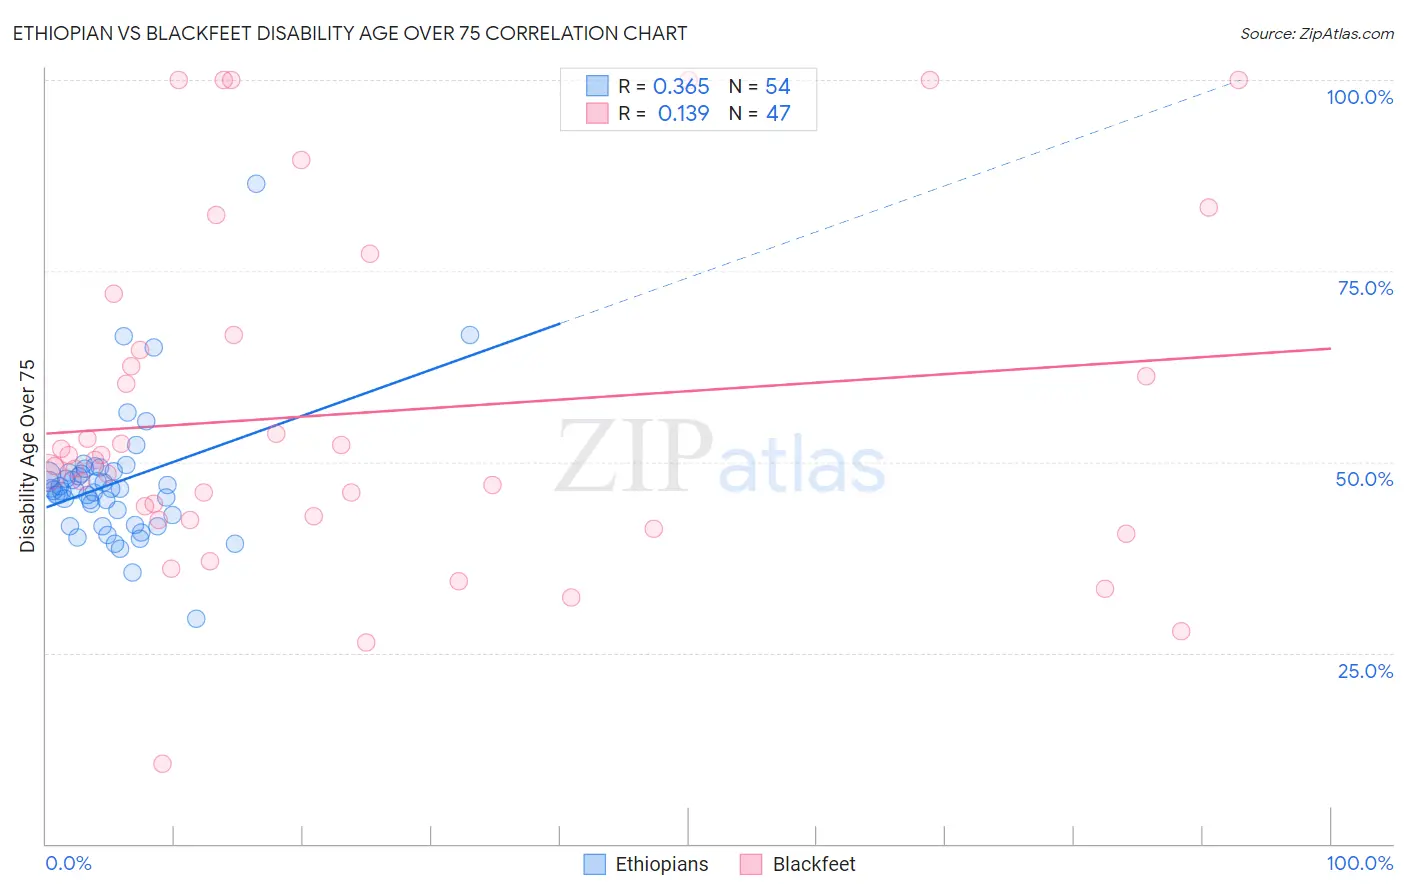
Ethiopian vs Blackfeet Disability Age Over 75 Correlation Chart

The statistical analysis conducted on geographies consisting of 222,925,097 people shows a mild positive correlation between the proportion of Ethiopians and percentage of population with a disability over the age of 75 in the United States with a correlation coefficient (R) of 0.365 and weighted average of 46.8%. Similarly, the statistical analysis conducted on geographies consisting of 309,061,440 people shows a poor positive correlation between the proportion of Blackfeet and percentage of population with a disability over the age of 75 in the United States with a correlation coefficient (R) of 0.139 and weighted average of 48.8%, a difference of 4.2%.
Ethiopian vs Blackfeet Disability Age Over 75

Disability Age Over 75 Correlation Summary

MeasurementEthiopianBlackfeet
Minimum29.5%10.4%
Maximum86.5%100.0%
Range57.0%89.6%
Mean47.3%56.4%
Median46.4%50.3%
Interquartile 25% (IQ1)43.0%42.5%
Interquartile 75% (IQ3)48.6%66.7%
Interquartile Range (IQR)5.5%24.2%
Standard Deviation (Sample)8.5%22.5%
Standard Deviation (Population)8.4%22.2%

Similar Demographics by Disability Age Over 75

Demographics Similar to Ethiopians by Disability Age Over 75

In terms of disability age over 75, the demographic groups most similar to Ethiopians are Immigrants from Ethiopia (46.8%, a difference of 0.010%), Immigrants from Venezuela (46.8%, a difference of 0.010%), Immigrants from Uganda (46.8%, a difference of 0.020%), Immigrants from Bosnia and Herzegovina (46.8%, a difference of 0.020%), and Yugoslavian (46.8%, a difference of 0.020%).
DemographicsRating | RankDisability Age Over 75
Icelanders
90.9
/100
|
#128
Exceptional
46.7%
Immigrants | Germany
90.8
/100
|
#129
Exceptional
46.7%
Immigrants | Northern Africa
90.7
/100
|
#130
Exceptional
46.7%
Scottish
90.5
/100
|
#131
Exceptional
46.7%
South Americans
90.0
/100
|
#132
Excellent
46.8%
English
89.4
/100
|
#133
Excellent
46.8%
Immigrants | Ethiopia
89.1
/100
|
#134
Excellent
46.8%
Ethiopians
88.9
/100
|
#135
Excellent
46.8%
Immigrants | Venezuela
88.6
/100
|
#136
Excellent
46.8%
Immigrants | Uganda
88.5
/100
|
#137
Excellent
46.8%
Immigrants | Bosnia and Herzegovina
88.5
/100
|
#138
Excellent
46.8%
Yugoslavians
88.5
/100
|
#139
Excellent
46.8%
Immigrants | Costa Rica
87.4
/100
|
#140
Excellent
46.8%
Lebanese
87.0
/100
|
#141
Excellent
46.8%
Peruvians
86.5
/100
|
#142
Excellent
46.8%

Demographics Similar to Blackfeet by Disability Age Over 75

In terms of disability age over 75, the demographic groups most similar to Blackfeet are Immigrants from Philippines (48.8%, a difference of 0.040%), Immigrants from Congo (48.7%, a difference of 0.050%), Chinese (48.7%, a difference of 0.060%), Immigrants from Vietnam (48.7%, a difference of 0.10%), and Central American (48.8%, a difference of 0.11%).
DemographicsRating | RankDisability Age Over 75
West Indians
0.8
/100
|
#250
Tragic
48.6%
Koreans
0.8
/100
|
#251
Tragic
48.6%
Immigrants | South Eastern Asia
0.7
/100
|
#252
Tragic
48.7%
British West Indians
0.6
/100
|
#253
Tragic
48.7%
Immigrants | Vietnam
0.6
/100
|
#254
Tragic
48.7%
Chinese
0.5
/100
|
#255
Tragic
48.7%
Immigrants | Congo
0.5
/100
|
#256
Tragic
48.7%
Blackfeet
0.5
/100
|
#257
Tragic
48.8%
Immigrants | Philippines
0.4
/100
|
#258
Tragic
48.8%
Central Americans
0.4
/100
|
#259
Tragic
48.8%
Immigrants | Afghanistan
0.4
/100
|
#260
Tragic
48.8%
Africans
0.3
/100
|
#261
Tragic
48.9%
Immigrants | West Indies
0.3
/100
|
#262
Tragic
48.9%
Salvadorans
0.3
/100
|
#263
Tragic
48.9%
Immigrants | Honduras
0.3
/100
|
#264
Tragic
48.9%