Estonian vs Immigrants from Saudi Arabia Vision Disability
COMPARE
Estonian
Immigrants from Saudi Arabia
Vision Disability
Vision Disability Comparison
Estonians
Immigrants from Saudi Arabia
2.1%
VISION DISABILITY
95.3/ 100
METRIC RATING
99th/ 347
METRIC RANK
2.0%
VISION DISABILITY
99.2/ 100
METRIC RATING
58th/ 347
METRIC RANK
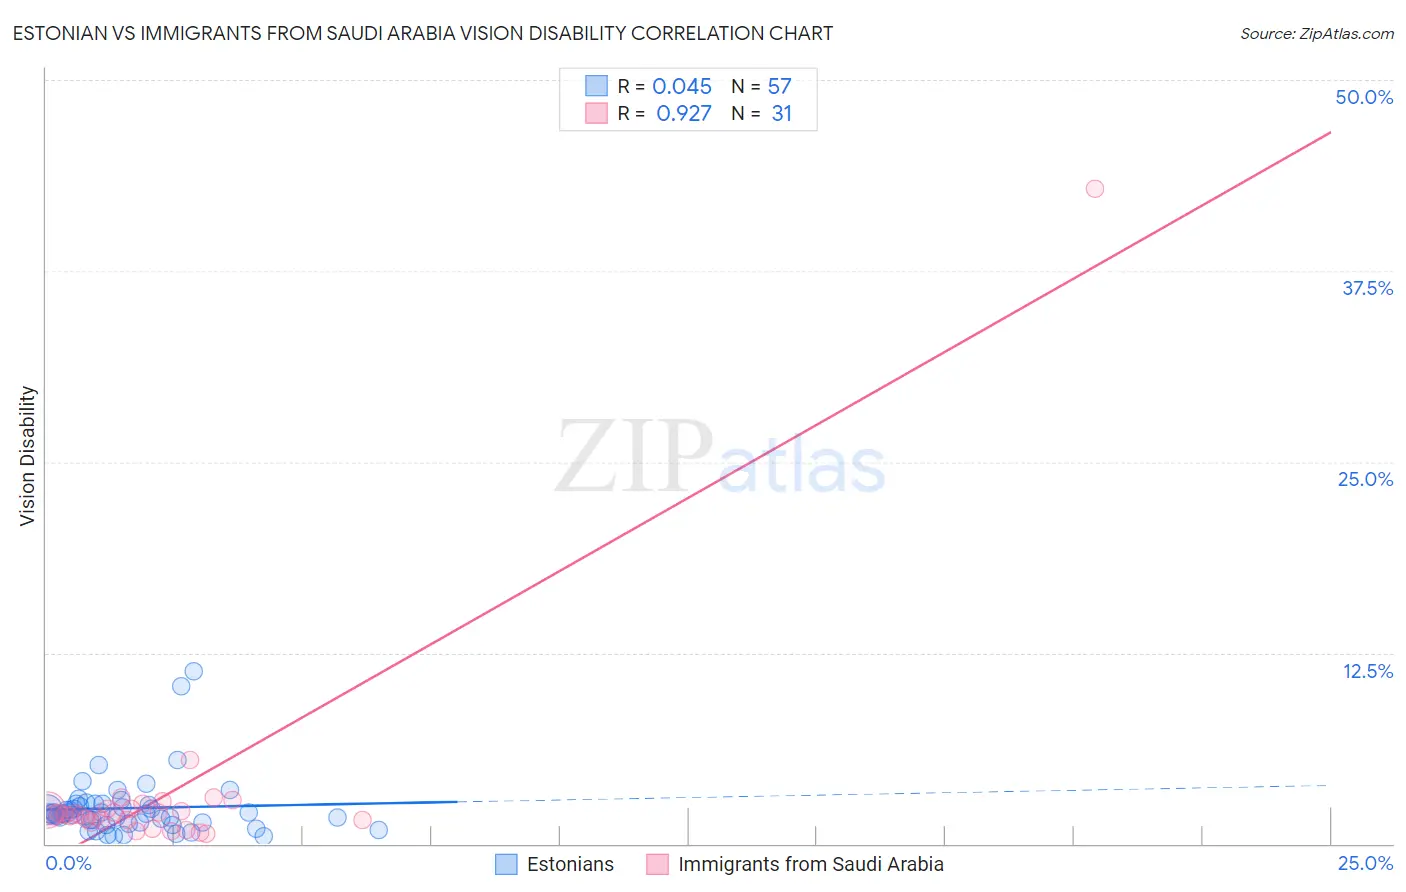
Estonian vs Immigrants from Saudi Arabia Vision Disability Correlation Chart
The statistical analysis conducted on geographies consisting of 123,516,084 people shows no correlation between the proportion of Estonians and percentage of population with vision disability in the United States with a correlation coefficient (R) of 0.045 and weighted average of 2.1%. Similarly, the statistical analysis conducted on geographies consisting of 164,271,694 people shows a near-perfect positive correlation between the proportion of Immigrants from Saudi Arabia and percentage of population with vision disability in the United States with a correlation coefficient (R) of 0.927 and weighted average of 2.0%, a difference of 3.1%.
Vision Disability Correlation Summary
| Measurement | Estonian | Immigrants from Saudi Arabia |
| Minimum | 0.45% | 0.68% |
| Maximum | 11.3% | 42.9% |
| Range | 10.8% | 42.2% |
| Mean | 2.3% | 3.3% |
| Median | 2.0% | 1.9% |
| Interquartile 25% (IQ1) | 1.4% | 1.5% |
| Interquartile 75% (IQ3) | 2.6% | 2.3% |
| Interquartile Range (IQR) | 1.1% | 0.77% |
| Standard Deviation (Sample) | 1.9% | 7.4% |
| Standard Deviation (Population) | 1.9% | 7.3% |
Similar Demographics by Vision Disability
Demographics Similar to Estonians by Vision Disability
In terms of vision disability, the demographic groups most similar to Estonians are Greek (2.1%, a difference of 0.040%), Immigrants from South Africa (2.1%, a difference of 0.070%), Immigrants from Afghanistan (2.1%, a difference of 0.12%), Albanian (2.1%, a difference of 0.12%), and Sri Lankan (2.1%, a difference of 0.15%).
| Demographics | Rating | Rank | Vision Disability |
| Immigrants | Syria | 96.2 /100 | #92 | Exceptional 2.1% |
| Immigrants | Europe | 96.1 /100 | #93 | Exceptional 2.1% |
| Immigrants | Croatia | 96.0 /100 | #94 | Exceptional 2.1% |
| Australians | 95.9 /100 | #95 | Exceptional 2.1% |
| Romanians | 95.7 /100 | #96 | Exceptional 2.1% |
| Immigrants | Afghanistan | 95.6 /100 | #97 | Exceptional 2.1% |
| Immigrants | South Africa | 95.4 /100 | #98 | Exceptional 2.1% |
| Estonians | 95.3 /100 | #99 | Exceptional 2.1% |
| Greeks | 95.1 /100 | #100 | Exceptional 2.1% |
| Albanians | 94.9 /100 | #101 | Exceptional 2.1% |
| Sri Lankans | 94.8 /100 | #102 | Exceptional 2.1% |
| Immigrants | Austria | 94.4 /100 | #103 | Exceptional 2.1% |
| Immigrants | Italy | 94.4 /100 | #104 | Exceptional 2.1% |
| Carpatho Rusyns | 94.3 /100 | #105 | Exceptional 2.1% |
| Swedes | 94.2 /100 | #106 | Exceptional 2.1% |
Demographics Similar to Immigrants from Saudi Arabia by Vision Disability
In terms of vision disability, the demographic groups most similar to Immigrants from Saudi Arabia are Somali (2.0%, a difference of 0.070%), Jordanian (2.0%, a difference of 0.090%), Argentinean (2.0%, a difference of 0.14%), Immigrants from Romania (2.0%, a difference of 0.17%), and Immigrants from Belgium (2.0%, a difference of 0.18%).
| Demographics | Rating | Rank | Vision Disability |
| Tongans | 99.5 /100 | #51 | Exceptional 2.0% |
| Immigrants | Serbia | 99.4 /100 | #52 | Exceptional 2.0% |
| Immigrants | Belarus | 99.3 /100 | #53 | Exceptional 2.0% |
| Macedonians | 99.3 /100 | #54 | Exceptional 2.0% |
| Laotians | 99.3 /100 | #55 | Exceptional 2.0% |
| Jordanians | 99.2 /100 | #56 | Exceptional 2.0% |
| Somalis | 99.2 /100 | #57 | Exceptional 2.0% |
| Immigrants | Saudi Arabia | 99.2 /100 | #58 | Exceptional 2.0% |
| Argentineans | 99.1 /100 | #59 | Exceptional 2.0% |
| Immigrants | Romania | 99.1 /100 | #60 | Exceptional 2.0% |
| Immigrants | Belgium | 99.1 /100 | #61 | Exceptional 2.0% |
| Immigrants | Russia | 99.1 /100 | #62 | Exceptional 2.0% |
| Armenians | 99.0 /100 | #63 | Exceptional 2.0% |
| Immigrants | Greece | 99.0 /100 | #64 | Exceptional 2.0% |
| Maltese | 98.9 /100 | #65 | Exceptional 2.0% |