Estonian vs Immigrants from Croatia Disability Age Over 75
COMPARE
Estonian
Immigrants from Croatia
Disability Age Over 75
Disability Age Over 75 Comparison
Estonians
Immigrants from Croatia
45.6%
DISABILITY AGE OVER 75
99.9/ 100
METRIC RATING
39th/ 347
METRIC RANK
45.5%
DISABILITY AGE OVER 75
99.9/ 100
METRIC RATING
33rd/ 347
METRIC RANK
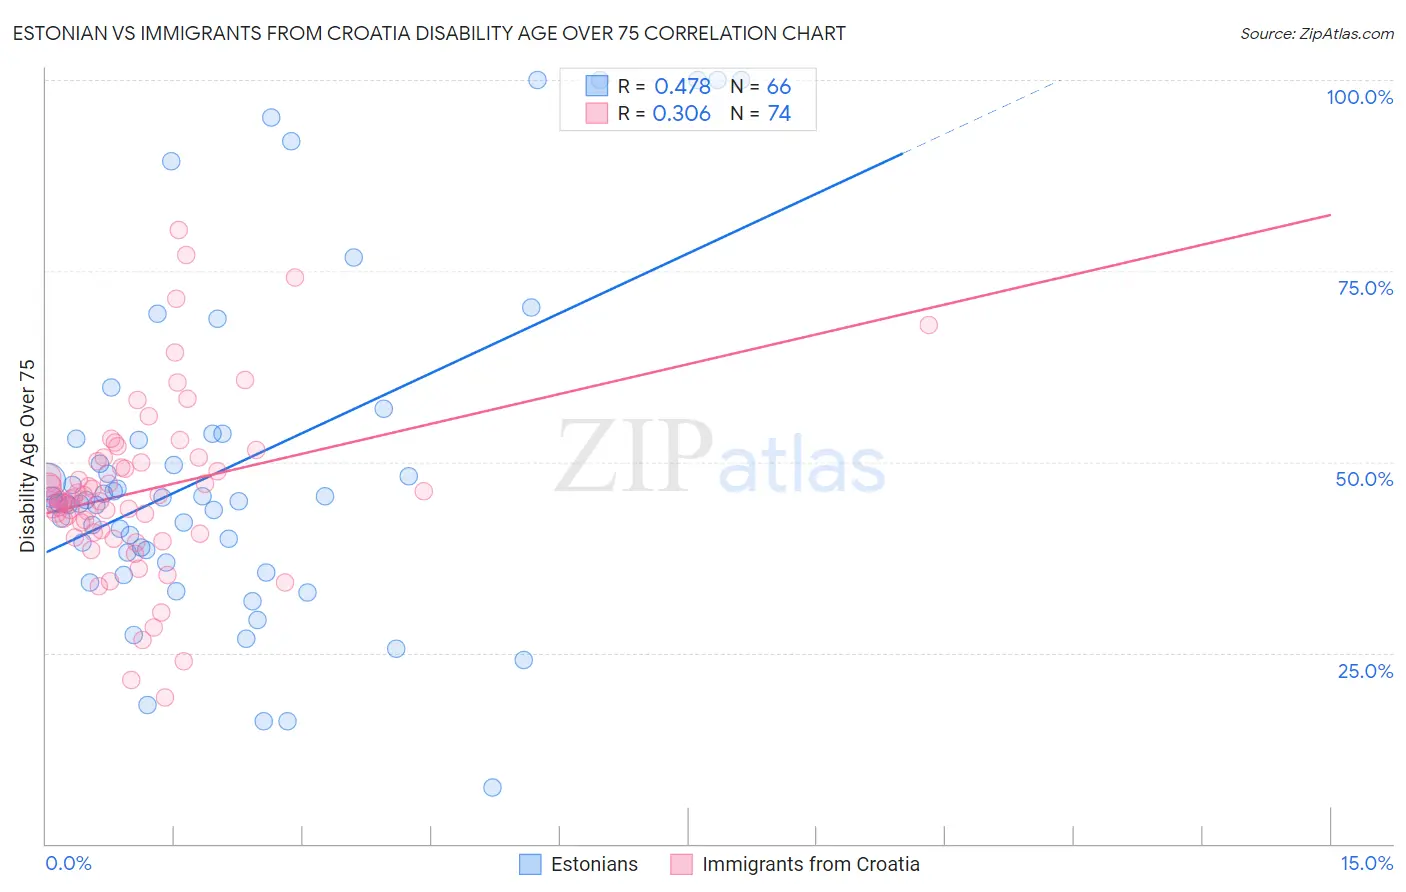
Estonian vs Immigrants from Croatia Disability Age Over 75 Correlation Chart
The statistical analysis conducted on geographies consisting of 123,486,929 people shows a moderate positive correlation between the proportion of Estonians and percentage of population with a disability over the age of 75 in the United States with a correlation coefficient (R) of 0.478 and weighted average of 45.6%. Similarly, the statistical analysis conducted on geographies consisting of 132,556,721 people shows a mild positive correlation between the proportion of Immigrants from Croatia and percentage of population with a disability over the age of 75 in the United States with a correlation coefficient (R) of 0.306 and weighted average of 45.5%, a difference of 0.18%.
Disability Age Over 75 Correlation Summary
| Measurement | Estonian | Immigrants from Croatia |
| Minimum | 7.4% | 19.1% |
| Maximum | 100.0% | 80.4% |
| Range | 92.6% | 61.3% |
| Mean | 49.0% | 46.2% |
| Median | 44.8% | 45.3% |
| Interquartile 25% (IQ1) | 38.1% | 40.8% |
| Interquartile 75% (IQ3) | 53.0% | 50.0% |
| Interquartile Range (IQR) | 14.9% | 9.3% |
| Standard Deviation (Sample) | 21.8% | 11.4% |
| Standard Deviation (Population) | 21.6% | 11.3% |
Demographics Similar to Estonians and Immigrants from Croatia by Disability Age Over 75
In terms of disability age over 75, the demographic groups most similar to Estonians are Italian (45.6%, a difference of 0.050%), Slovene (45.6%, a difference of 0.050%), Immigrants from Singapore (45.6%, a difference of 0.090%), Immigrants from Taiwan (45.5%, a difference of 0.11%), and South African (45.5%, a difference of 0.11%). Similarly, the demographic groups most similar to Immigrants from Croatia are Russian (45.5%, a difference of 0.030%), Norwegian (45.5%, a difference of 0.040%), Immigrants from Australia (45.5%, a difference of 0.060%), Immigrants from Taiwan (45.5%, a difference of 0.070%), and South African (45.5%, a difference of 0.070%).
| Demographics | Rating | Rank | Disability Age Over 75 |
| Macedonians | 99.9 /100 | #26 | Exceptional 45.4% |
| Immigrants | Poland | 99.9 /100 | #27 | Exceptional 45.4% |
| Thais | 99.9 /100 | #28 | Exceptional 45.4% |
| Filipinos | 99.9 /100 | #29 | Exceptional 45.4% |
| Immigrants | Denmark | 99.9 /100 | #30 | Exceptional 45.4% |
| Immigrants | Bulgaria | 99.9 /100 | #31 | Exceptional 45.5% |
| Immigrants | Australia | 99.9 /100 | #32 | Exceptional 45.5% |
| Immigrants | Croatia | 99.9 /100 | #33 | Exceptional 45.5% |
| Russians | 99.9 /100 | #34 | Exceptional 45.5% |
| Norwegians | 99.9 /100 | #35 | Exceptional 45.5% |
| Immigrants | Taiwan | 99.9 /100 | #36 | Exceptional 45.5% |
| South Africans | 99.9 /100 | #37 | Exceptional 45.5% |
| Italians | 99.9 /100 | #38 | Exceptional 45.6% |
| Estonians | 99.9 /100 | #39 | Exceptional 45.6% |
| Slovenes | 99.9 /100 | #40 | Exceptional 45.6% |
| Immigrants | Singapore | 99.8 /100 | #41 | Exceptional 45.6% |
| Greeks | 99.8 /100 | #42 | Exceptional 45.6% |
| Czechs | 99.8 /100 | #43 | Exceptional 45.7% |
| Australians | 99.8 /100 | #44 | Exceptional 45.7% |
| Turks | 99.8 /100 | #45 | Exceptional 45.7% |
| Swedes | 99.8 /100 | #46 | Exceptional 45.7% |