English vs African Ambulatory Disability
COMPARE
English
African
Ambulatory Disability
Ambulatory Disability Comparison
English
Africans
6.6%
AMBULATORY DISABILITY
0.4/ 100
METRIC RATING
262nd/ 347
METRIC RANK
7.0%
AMBULATORY DISABILITY
0.0/ 100
METRIC RATING
303rd/ 347
METRIC RANK
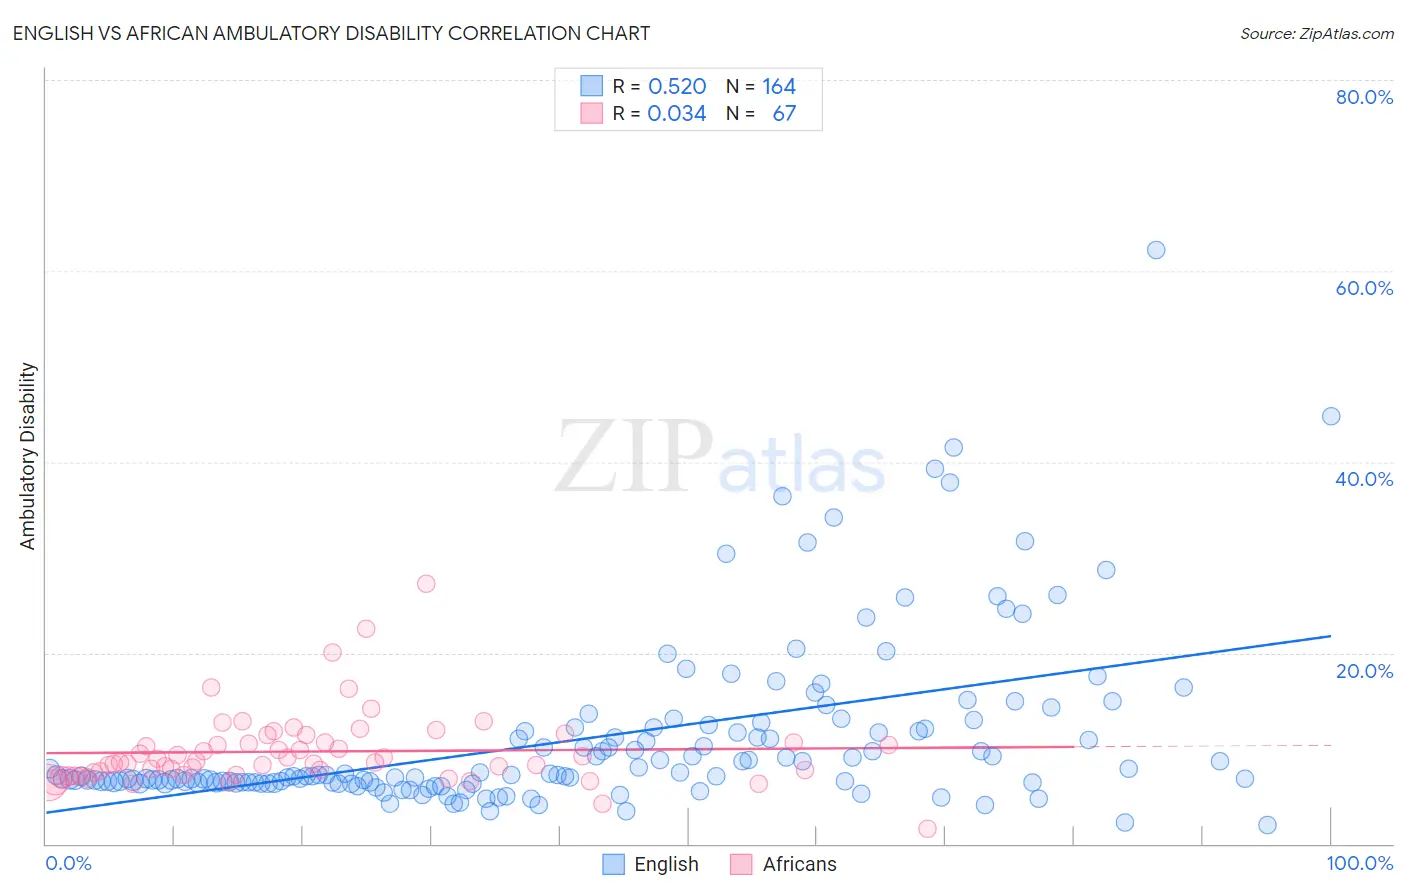
English vs African Ambulatory Disability Correlation Chart
The statistical analysis conducted on geographies consisting of 579,179,335 people shows a substantial positive correlation between the proportion of English and percentage of population with ambulatory disability in the United States with a correlation coefficient (R) of 0.520 and weighted average of 6.6%. Similarly, the statistical analysis conducted on geographies consisting of 469,824,822 people shows no correlation between the proportion of Africans and percentage of population with ambulatory disability in the United States with a correlation coefficient (R) of 0.034 and weighted average of 7.0%, a difference of 6.0%.
Ambulatory Disability Correlation Summary
| Measurement | English | African |
| Minimum | 2.0% | 1.5% |
| Maximum | 62.2% | 27.3% |
| Range | 60.2% | 25.7% |
| Mean | 11.0% | 9.7% |
| Median | 7.1% | 8.6% |
| Interquartile 25% (IQ1) | 6.4% | 7.3% |
| Interquartile 75% (IQ3) | 11.9% | 10.6% |
| Interquartile Range (IQR) | 5.5% | 3.4% |
| Standard Deviation (Sample) | 9.0% | 3.9% |
| Standard Deviation (Population) | 8.9% | 3.9% |
Similar Demographics by Ambulatory Disability
Demographics Similar to English by Ambulatory Disability
In terms of ambulatory disability, the demographic groups most similar to English are Hmong (6.6%, a difference of 0.12%), Irish (6.6%, a difference of 0.17%), Immigrants from Belize (6.6%, a difference of 0.24%), Aleut (6.6%, a difference of 0.25%), and Spanish American Indian (6.5%, a difference of 0.43%).
| Demographics | Rating | Rank | Ambulatory Disability |
| Welsh | 0.6 /100 | #255 | Tragic 6.5% |
| Immigrants | Uzbekistan | 0.6 /100 | #256 | Tragic 6.5% |
| Bermudans | 0.5 /100 | #257 | Tragic 6.5% |
| Spanish American Indians | 0.5 /100 | #258 | Tragic 6.5% |
| Aleuts | 0.4 /100 | #259 | Tragic 6.6% |
| Immigrants | Belize | 0.4 /100 | #260 | Tragic 6.6% |
| Irish | 0.4 /100 | #261 | Tragic 6.6% |
| English | 0.4 /100 | #262 | Tragic 6.6% |
| Hmong | 0.3 /100 | #263 | Tragic 6.6% |
| Nepalese | 0.2 /100 | #264 | Tragic 6.6% |
| Bahamians | 0.2 /100 | #265 | Tragic 6.6% |
| Guyanese | 0.2 /100 | #266 | Tragic 6.6% |
| Trinidadians and Tobagonians | 0.2 /100 | #267 | Tragic 6.6% |
| Spanish | 0.2 /100 | #268 | Tragic 6.6% |
| French | 0.1 /100 | #269 | Tragic 6.6% |
Demographics Similar to Africans by Ambulatory Disability
In terms of ambulatory disability, the demographic groups most similar to Africans are Immigrants from Armenia (7.0%, a difference of 0.060%), British West Indian (7.0%, a difference of 0.11%), Marshallese (6.9%, a difference of 0.34%), Puget Sound Salish (6.9%, a difference of 0.35%), and Immigrants from Cabo Verde (7.0%, a difference of 0.36%).
| Demographics | Rating | Rank | Ambulatory Disability |
| Alaskan Athabascans | 0.0 /100 | #296 | Tragic 6.9% |
| French American Indians | 0.0 /100 | #297 | Tragic 6.9% |
| Immigrants | Grenada | 0.0 /100 | #298 | Tragic 6.9% |
| Puget Sound Salish | 0.0 /100 | #299 | Tragic 6.9% |
| Marshallese | 0.0 /100 | #300 | Tragic 6.9% |
| British West Indians | 0.0 /100 | #301 | Tragic 7.0% |
| Immigrants | Armenia | 0.0 /100 | #302 | Tragic 7.0% |
| Africans | 0.0 /100 | #303 | Tragic 7.0% |
| Immigrants | Cabo Verde | 0.0 /100 | #304 | Tragic 7.0% |
| Immigrants | Micronesia | 0.0 /100 | #305 | Tragic 7.0% |
| Iroquois | 0.0 /100 | #306 | Tragic 7.1% |
| Spanish Americans | 0.0 /100 | #307 | Tragic 7.1% |
| Chippewa | 0.0 /100 | #308 | Tragic 7.1% |
| Immigrants | Azores | 0.0 /100 | #309 | Tragic 7.1% |
| Arapaho | 0.0 /100 | #310 | Tragic 7.1% |