Eastern European vs Immigrants from South Eastern Asia Disability Age 65 to 74
COMPARE
Eastern European
Immigrants from South Eastern Asia
Disability Age 65 to 74
Disability Age 65 to 74 Comparison
Eastern Europeans
Immigrants from South Eastern Asia
20.6%
DISABILITY AGE 65 TO 74
100.0/ 100
METRIC RATING
18th/ 347
METRIC RANK
23.3%
DISABILITY AGE 65 TO 74
50.0/ 100
METRIC RATING
174th/ 347
METRIC RANK
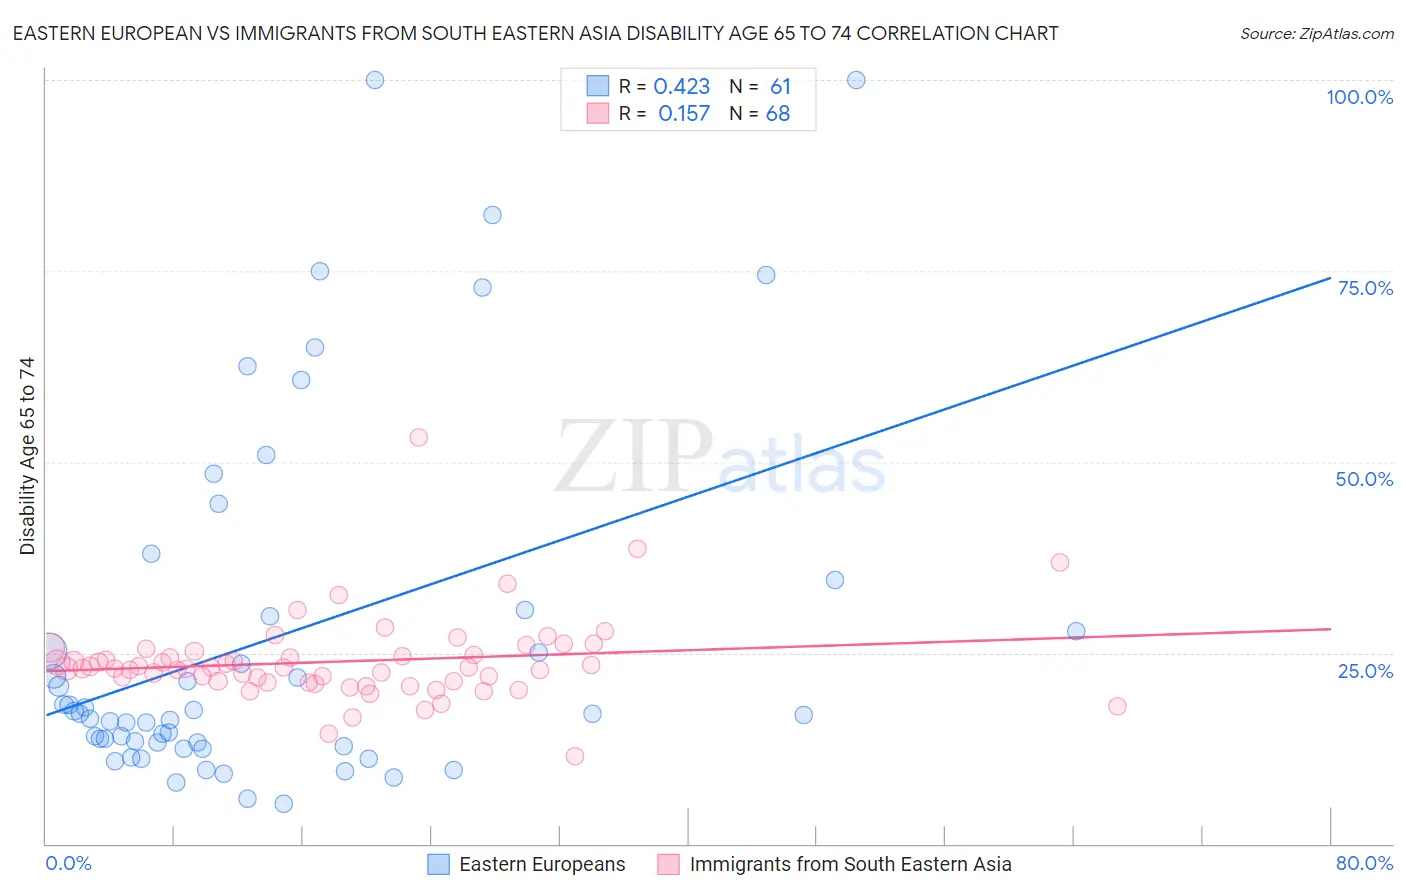
Eastern European vs Immigrants from South Eastern Asia Disability Age 65 to 74 Correlation Chart
The statistical analysis conducted on geographies consisting of 460,228,956 people shows a moderate positive correlation between the proportion of Eastern Europeans and percentage of population with a disability between the ages 65 and 75 in the United States with a correlation coefficient (R) of 0.423 and weighted average of 20.6%. Similarly, the statistical analysis conducted on geographies consisting of 511,151,711 people shows a poor positive correlation between the proportion of Immigrants from South Eastern Asia and percentage of population with a disability between the ages 65 and 75 in the United States with a correlation coefficient (R) of 0.157 and weighted average of 23.3%, a difference of 13.2%.
Disability Age 65 to 74 Correlation Summary
| Measurement | Eastern European | Immigrants from South Eastern Asia |
| Minimum | 5.2% | 11.5% |
| Maximum | 100.0% | 53.2% |
| Range | 94.8% | 41.6% |
| Mean | 27.0% | 23.9% |
| Median | 17.0% | 23.0% |
| Interquartile 25% (IQ1) | 13.0% | 21.2% |
| Interquartile 75% (IQ3) | 30.2% | 25.0% |
| Interquartile Range (IQR) | 17.2% | 3.7% |
| Standard Deviation (Sample) | 23.5% | 5.7% |
| Standard Deviation (Population) | 23.4% | 5.6% |
Similar Demographics by Disability Age 65 to 74
Demographics Similar to Eastern Europeans by Disability Age 65 to 74
In terms of disability age 65 to 74, the demographic groups most similar to Eastern Europeans are Burmese (20.6%, a difference of 0.030%), Immigrants from South Central Asia (20.6%, a difference of 0.070%), Immigrants from Lithuania (20.5%, a difference of 0.32%), Okinawan (20.7%, a difference of 0.35%), and Paraguayan (20.5%, a difference of 0.38%).
| Demographics | Rating | Rank | Disability Age 65 to 74 |
| Immigrants | Ireland | 100.0 /100 | #11 | Exceptional 20.3% |
| Immigrants | Korea | 100.0 /100 | #12 | Exceptional 20.4% |
| Immigrants | Singapore | 100.0 /100 | #13 | Exceptional 20.4% |
| Indians (Asian) | 100.0 /100 | #14 | Exceptional 20.5% |
| Paraguayans | 100.0 /100 | #15 | Exceptional 20.5% |
| Immigrants | Lithuania | 100.0 /100 | #16 | Exceptional 20.5% |
| Immigrants | South Central Asia | 100.0 /100 | #17 | Exceptional 20.6% |
| Eastern Europeans | 100.0 /100 | #18 | Exceptional 20.6% |
| Burmese | 100.0 /100 | #19 | Exceptional 20.6% |
| Okinawans | 100.0 /100 | #20 | Exceptional 20.7% |
| Immigrants | Bolivia | 99.9 /100 | #21 | Exceptional 20.8% |
| Immigrants | Iran | 99.9 /100 | #22 | Exceptional 20.9% |
| Immigrants | Belgium | 99.9 /100 | #23 | Exceptional 21.0% |
| Soviet Union | 99.9 /100 | #24 | Exceptional 21.0% |
| Bolivians | 99.9 /100 | #25 | Exceptional 21.0% |
Demographics Similar to Immigrants from South Eastern Asia by Disability Age 65 to 74
In terms of disability age 65 to 74, the demographic groups most similar to Immigrants from South Eastern Asia are Yugoslavian (23.3%, a difference of 0.010%), German (23.3%, a difference of 0.030%), Dutch (23.3%, a difference of 0.040%), Cuban (23.3%, a difference of 0.11%), and Immigrants from Eritrea (23.4%, a difference of 0.14%).
| Demographics | Rating | Rank | Disability Age 65 to 74 |
| Immigrants | Bosnia and Herzegovina | 57.6 /100 | #167 | Average 23.2% |
| Pakistanis | 57.0 /100 | #168 | Average 23.2% |
| Icelanders | 54.3 /100 | #169 | Average 23.3% |
| Moroccans | 54.2 /100 | #170 | Average 23.3% |
| Cubans | 51.9 /100 | #171 | Average 23.3% |
| Germans | 50.5 /100 | #172 | Average 23.3% |
| Yugoslavians | 50.2 /100 | #173 | Average 23.3% |
| Immigrants | South Eastern Asia | 50.0 /100 | #174 | Average 23.3% |
| Dutch | 49.4 /100 | #175 | Average 23.3% |
| Immigrants | Eritrea | 47.5 /100 | #176 | Average 23.4% |
| Immigrants | Haiti | 47.5 /100 | #177 | Average 23.4% |
| Guyanese | 45.8 /100 | #178 | Average 23.4% |
| Immigrants | Sierra Leone | 45.8 /100 | #179 | Average 23.4% |
| Scandinavians | 45.6 /100 | #180 | Average 23.4% |
| Assyrians/Chaldeans/Syriacs | 45.3 /100 | #181 | Average 23.4% |