Dutch West Indian vs Immigrants from Honduras Disability Age 65 to 74
COMPARE
Dutch West Indian
Immigrants from Honduras
Disability Age 65 to 74
Disability Age 65 to 74 Comparison
Dutch West Indians
Immigrants from Honduras
29.6%
DISABILITY AGE 65 TO 74
0.0/ 100
METRIC RATING
325th/ 347
METRIC RANK
25.9%
DISABILITY AGE 65 TO 74
0.1/ 100
METRIC RATING
281st/ 347
METRIC RANK
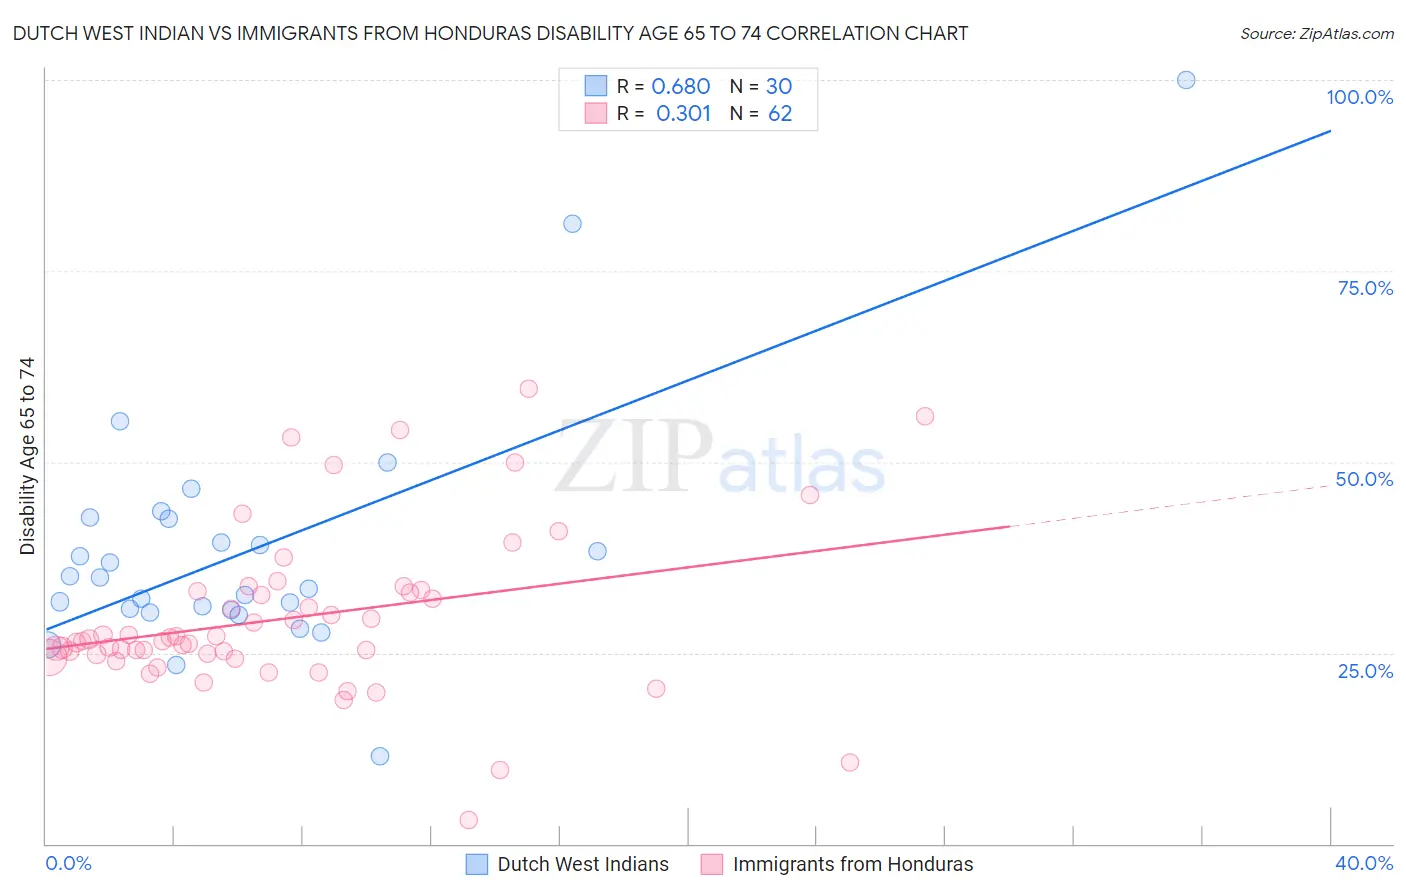
Dutch West Indian vs Immigrants from Honduras Disability Age 65 to 74 Correlation Chart
The statistical analysis conducted on geographies consisting of 85,748,630 people shows a significant positive correlation between the proportion of Dutch West Indians and percentage of population with a disability between the ages 65 and 75 in the United States with a correlation coefficient (R) of 0.680 and weighted average of 29.6%. Similarly, the statistical analysis conducted on geographies consisting of 322,261,679 people shows a mild positive correlation between the proportion of Immigrants from Honduras and percentage of population with a disability between the ages 65 and 75 in the United States with a correlation coefficient (R) of 0.301 and weighted average of 25.9%, a difference of 14.2%.
Disability Age 65 to 74 Correlation Summary
| Measurement | Dutch West Indian | Immigrants from Honduras |
| Minimum | 11.5% | 3.1% |
| Maximum | 100.0% | 59.5% |
| Range | 88.5% | 56.4% |
| Mean | 38.5% | 29.6% |
| Median | 34.1% | 26.7% |
| Interquartile 25% (IQ1) | 30.5% | 24.8% |
| Interquartile 75% (IQ3) | 42.5% | 33.0% |
| Interquartile Range (IQR) | 12.0% | 8.2% |
| Standard Deviation (Sample) | 16.6% | 10.6% |
| Standard Deviation (Population) | 16.4% | 10.6% |
Similar Demographics by Disability Age 65 to 74
Demographics Similar to Dutch West Indians by Disability Age 65 to 74
In terms of disability age 65 to 74, the demographic groups most similar to Dutch West Indians are Yakama (29.6%, a difference of 0.23%), Apache (29.7%, a difference of 0.38%), Seminole (29.4%, a difference of 0.45%), Hopi (30.0%, a difference of 1.3%), and Puerto Rican (29.1%, a difference of 1.4%).
| Demographics | Rating | Rank | Disability Age 65 to 74 |
| Nepalese | 0.0 /100 | #318 | Tragic 28.0% |
| Arapaho | 0.0 /100 | #319 | Tragic 28.1% |
| Cherokee | 0.0 /100 | #320 | Tragic 28.2% |
| Comanche | 0.0 /100 | #321 | Tragic 28.3% |
| Aleuts | 0.0 /100 | #322 | Tragic 28.4% |
| Puerto Ricans | 0.0 /100 | #323 | Tragic 29.1% |
| Seminole | 0.0 /100 | #324 | Tragic 29.4% |
| Dutch West Indians | 0.0 /100 | #325 | Tragic 29.6% |
| Yakama | 0.0 /100 | #326 | Tragic 29.6% |
| Apache | 0.0 /100 | #327 | Tragic 29.7% |
| Hopi | 0.0 /100 | #328 | Tragic 30.0% |
| Choctaw | 0.0 /100 | #329 | Tragic 30.2% |
| Creek | 0.0 /100 | #330 | Tragic 30.2% |
| Chickasaw | 0.0 /100 | #331 | Tragic 30.2% |
| Natives/Alaskans | 0.0 /100 | #332 | Tragic 30.4% |
Demographics Similar to Immigrants from Honduras by Disability Age 65 to 74
In terms of disability age 65 to 74, the demographic groups most similar to Immigrants from Honduras are Cree (25.9%, a difference of 0.020%), Delaware (25.9%, a difference of 0.070%), U.S. Virgin Islander (25.9%, a difference of 0.10%), Immigrants from Belize (25.8%, a difference of 0.19%), and Belizean (25.8%, a difference of 0.21%).
| Demographics | Rating | Rank | Disability Age 65 to 74 |
| Americans | 0.1 /100 | #274 | Tragic 25.8% |
| Hondurans | 0.1 /100 | #275 | Tragic 25.8% |
| French American Indians | 0.1 /100 | #276 | Tragic 25.8% |
| Belizeans | 0.1 /100 | #277 | Tragic 25.8% |
| Immigrants | Belize | 0.1 /100 | #278 | Tragic 25.8% |
| U.S. Virgin Islanders | 0.1 /100 | #279 | Tragic 25.9% |
| Cree | 0.1 /100 | #280 | Tragic 25.9% |
| Immigrants | Honduras | 0.1 /100 | #281 | Tragic 25.9% |
| Delaware | 0.1 /100 | #282 | Tragic 25.9% |
| Spanish Americans | 0.0 /100 | #283 | Tragic 25.9% |
| Immigrants | Azores | 0.0 /100 | #284 | Tragic 26.0% |
| Immigrants | Congo | 0.0 /100 | #285 | Tragic 26.0% |
| Immigrants | Micronesia | 0.0 /100 | #286 | Tragic 26.1% |
| Immigrants | Laos | 0.0 /100 | #287 | Tragic 26.1% |
| Mexican American Indians | 0.0 /100 | #288 | Tragic 26.2% |