Dominican vs Costa Rican Disability Age 35 to 64
COMPARE
Dominican
Costa Rican
Disability Age 35 to 64
Disability Age 35 to 64 Comparison
Dominicans
Costa Ricans
12.9%
DISABILITY AGE 35 TO 64
0.1/ 100
METRIC RATING
275th/ 347
METRIC RANK
10.7%
DISABILITY AGE 35 TO 64
91.4/ 100
METRIC RATING
139th/ 347
METRIC RANK
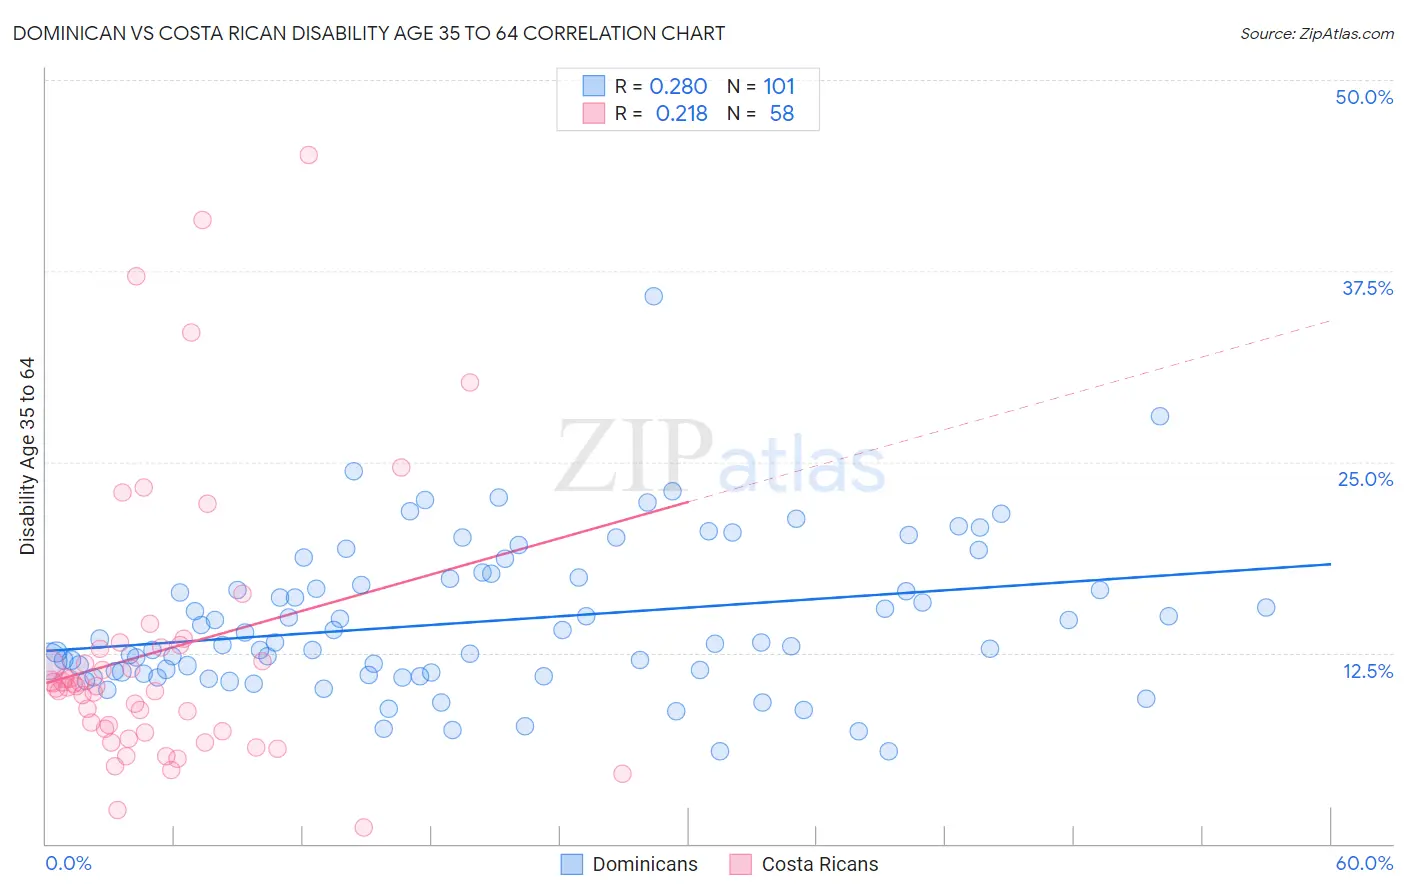
Dominican vs Costa Rican Disability Age 35 to 64 Correlation Chart
The statistical analysis conducted on geographies consisting of 354,697,529 people shows a weak positive correlation between the proportion of Dominicans and percentage of population with a disability between the ages 34 and 64 in the United States with a correlation coefficient (R) of 0.280 and weighted average of 12.9%. Similarly, the statistical analysis conducted on geographies consisting of 253,472,399 people shows a weak positive correlation between the proportion of Costa Ricans and percentage of population with a disability between the ages 34 and 64 in the United States with a correlation coefficient (R) of 0.218 and weighted average of 10.7%, a difference of 19.9%.
Disability Age 35 to 64 Correlation Summary
| Measurement | Dominican | Costa Rican |
| Minimum | 6.0% | 1.1% |
| Maximum | 35.9% | 45.1% |
| Range | 29.8% | 44.0% |
| Mean | 14.6% | 12.6% |
| Median | 13.1% | 10.3% |
| Interquartile 25% (IQ1) | 11.2% | 7.4% |
| Interquartile 75% (IQ3) | 17.4% | 12.9% |
| Interquartile Range (IQR) | 6.2% | 5.5% |
| Standard Deviation (Sample) | 4.9% | 9.1% |
| Standard Deviation (Population) | 4.9% | 9.0% |
Similar Demographics by Disability Age 35 to 64
Demographics Similar to Dominicans by Disability Age 35 to 64
In terms of disability age 35 to 64, the demographic groups most similar to Dominicans are Somali (12.9%, a difference of 0.12%), Celtic (12.9%, a difference of 0.14%), Pennsylvania German (12.8%, a difference of 0.16%), U.S. Virgin Islander (12.8%, a difference of 0.25%), and Immigrants from Dominican Republic (12.9%, a difference of 0.31%).
| Demographics | Rating | Rank | Disability Age 35 to 64 |
| Immigrants | Dominica | 0.2 /100 | #268 | Tragic 12.7% |
| Spanish | 0.2 /100 | #269 | Tragic 12.7% |
| French | 0.2 /100 | #270 | Tragic 12.7% |
| Nepalese | 0.1 /100 | #271 | Tragic 12.8% |
| U.S. Virgin Islanders | 0.1 /100 | #272 | Tragic 12.8% |
| Pennsylvania Germans | 0.1 /100 | #273 | Tragic 12.8% |
| Celtics | 0.1 /100 | #274 | Tragic 12.9% |
| Dominicans | 0.1 /100 | #275 | Tragic 12.9% |
| Somalis | 0.1 /100 | #276 | Tragic 12.9% |
| Immigrants | Dominican Republic | 0.1 /100 | #277 | Tragic 12.9% |
| French Canadians | 0.1 /100 | #278 | Tragic 12.9% |
| Immigrants | Micronesia | 0.1 /100 | #279 | Tragic 12.9% |
| Liberians | 0.1 /100 | #280 | Tragic 12.9% |
| Scotch-Irish | 0.1 /100 | #281 | Tragic 13.0% |
| Immigrants | Laos | 0.1 /100 | #282 | Tragic 13.0% |
Demographics Similar to Costa Ricans by Disability Age 35 to 64
In terms of disability age 35 to 64, the demographic groups most similar to Costa Ricans are Immigrants from Southern Europe (10.7%, a difference of 0.010%), Immigrants from Scotland (10.7%, a difference of 0.050%), Immigrants from Costa Rica (10.7%, a difference of 0.060%), Salvadoran (10.7%, a difference of 0.13%), and Australian (10.8%, a difference of 0.18%).
| Demographics | Rating | Rank | Disability Age 35 to 64 |
| Immigrants | Albania | 92.5 /100 | #132 | Exceptional 10.7% |
| Immigrants | Immigrants | 92.5 /100 | #133 | Exceptional 10.7% |
| Immigrants | Ecuador | 92.5 /100 | #134 | Exceptional 10.7% |
| Greeks | 92.3 /100 | #135 | Exceptional 10.7% |
| Salvadorans | 91.9 /100 | #136 | Exceptional 10.7% |
| Immigrants | Costa Rica | 91.7 /100 | #137 | Exceptional 10.7% |
| Immigrants | Southern Europe | 91.5 /100 | #138 | Exceptional 10.7% |
| Costa Ricans | 91.4 /100 | #139 | Exceptional 10.7% |
| Immigrants | Scotland | 91.3 /100 | #140 | Exceptional 10.7% |
| Australians | 90.7 /100 | #141 | Exceptional 10.8% |
| Immigrants | Saudi Arabia | 90.6 /100 | #142 | Exceptional 10.8% |
| Sierra Leoneans | 89.7 /100 | #143 | Excellent 10.8% |
| Lithuanians | 88.7 /100 | #144 | Excellent 10.8% |
| Immigrants | Bangladesh | 85.6 /100 | #145 | Excellent 10.9% |
| South American Indians | 83.5 /100 | #146 | Excellent 10.9% |