Delaware vs Immigrants from South Central Asia Cognitive Disability
COMPARE
Delaware
Immigrants from South Central Asia
Cognitive Disability
Cognitive Disability Comparison
Delaware
Immigrants from South Central Asia
17.4%
COGNITIVE DISABILITY
25.6/ 100
METRIC RATING
193rd/ 347
METRIC RANK
16.4%
COGNITIVE DISABILITY
99.9/ 100
METRIC RATING
22nd/ 347
METRIC RANK
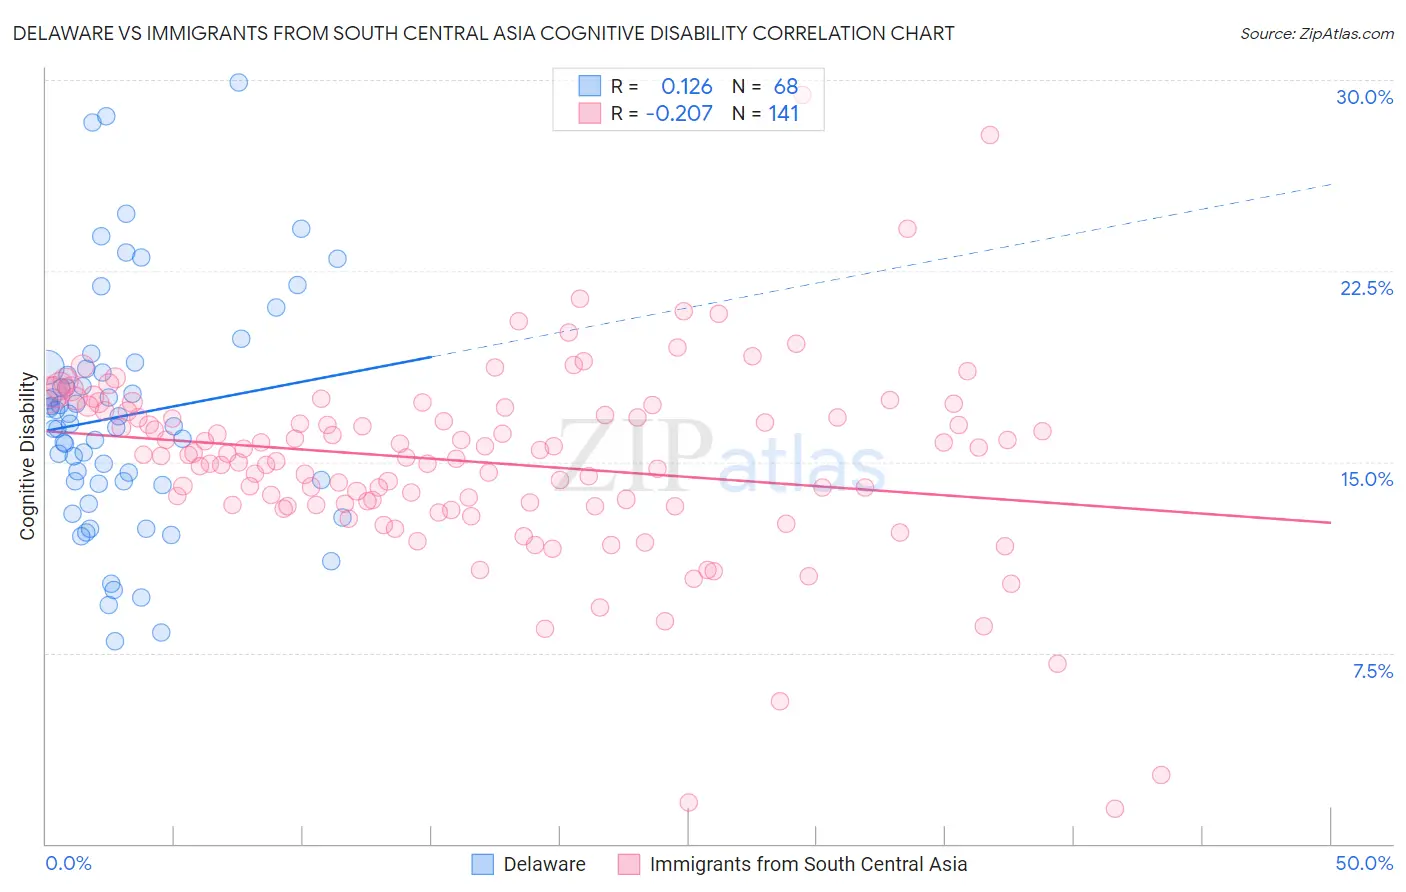
Delaware vs Immigrants from South Central Asia Cognitive Disability Correlation Chart
The statistical analysis conducted on geographies consisting of 96,240,838 people shows a poor positive correlation between the proportion of Delaware and percentage of population with cognitive disability in the United States with a correlation coefficient (R) of 0.126 and weighted average of 17.4%. Similarly, the statistical analysis conducted on geographies consisting of 473,055,858 people shows a weak negative correlation between the proportion of Immigrants from South Central Asia and percentage of population with cognitive disability in the United States with a correlation coefficient (R) of -0.207 and weighted average of 16.4%, a difference of 6.4%.
Cognitive Disability Correlation Summary
| Measurement | Delaware | Immigrants from South Central Asia |
| Minimum | 8.0% | 1.4% |
| Maximum | 29.9% | 29.4% |
| Range | 21.9% | 28.0% |
| Mean | 16.8% | 15.0% |
| Median | 16.5% | 15.3% |
| Interquartile 25% (IQ1) | 14.2% | 13.3% |
| Interquartile 75% (IQ3) | 18.6% | 17.0% |
| Interquartile Range (IQR) | 4.4% | 3.7% |
| Standard Deviation (Sample) | 4.6% | 3.8% |
| Standard Deviation (Population) | 4.6% | 3.8% |
Similar Demographics by Cognitive Disability
Demographics Similar to Delaware by Cognitive Disability
In terms of cognitive disability, the demographic groups most similar to Delaware are Immigrants from Haiti (17.4%, a difference of 0.050%), Nonimmigrants (17.4%, a difference of 0.060%), Immigrants from Spain (17.4%, a difference of 0.070%), Immigrants from Western Asia (17.4%, a difference of 0.14%), and Immigrants from Bosnia and Herzegovina (17.4%, a difference of 0.14%).
| Demographics | Rating | Rank | Cognitive Disability |
| Cambodians | 35.9 /100 | #186 | Fair 17.3% |
| Immigrants | Fiji | 33.7 /100 | #187 | Fair 17.4% |
| Immigrants | France | 29.8 /100 | #188 | Fair 17.4% |
| Immigrants | Western Asia | 29.5 /100 | #189 | Fair 17.4% |
| Immigrants | Spain | 27.7 /100 | #190 | Fair 17.4% |
| Immigrants | Nonimmigrants | 27.4 /100 | #191 | Fair 17.4% |
| Immigrants | Haiti | 27.1 /100 | #192 | Fair 17.4% |
| Delaware | 25.6 /100 | #193 | Fair 17.4% |
| Immigrants | Bosnia and Herzegovina | 22.0 /100 | #194 | Fair 17.4% |
| New Zealanders | 21.1 /100 | #195 | Fair 17.4% |
| Guyanese | 17.5 /100 | #196 | Poor 17.5% |
| Immigrants | Afghanistan | 16.7 /100 | #197 | Poor 17.5% |
| Immigrants | Panama | 14.8 /100 | #198 | Poor 17.5% |
| Immigrants | Singapore | 14.3 /100 | #199 | Poor 17.5% |
| Haitians | 14.1 /100 | #200 | Poor 17.5% |
Demographics Similar to Immigrants from South Central Asia by Cognitive Disability
In terms of cognitive disability, the demographic groups most similar to Immigrants from South Central Asia are Croatian (16.4%, a difference of 0.030%), Immigrants from Argentina (16.4%, a difference of 0.060%), Luxembourger (16.4%, a difference of 0.10%), Immigrants from Cuba (16.3%, a difference of 0.13%), and Immigrants from Croatia (16.4%, a difference of 0.13%).
| Demographics | Rating | Rank | Cognitive Disability |
| Immigrants | Greece | 100.0 /100 | #15 | Exceptional 16.3% |
| Eastern Europeans | 100.0 /100 | #16 | Exceptional 16.3% |
| Immigrants | North Macedonia | 100.0 /100 | #17 | Exceptional 16.3% |
| Immigrants | Northern Europe | 100.0 /100 | #18 | Exceptional 16.3% |
| Immigrants | Bolivia | 100.0 /100 | #19 | Exceptional 16.3% |
| Bulgarians | 100.0 /100 | #20 | Exceptional 16.3% |
| Immigrants | Cuba | 100.0 /100 | #21 | Exceptional 16.3% |
| Immigrants | South Central Asia | 99.9 /100 | #22 | Exceptional 16.4% |
| Croatians | 99.9 /100 | #23 | Exceptional 16.4% |
| Immigrants | Argentina | 99.9 /100 | #24 | Exceptional 16.4% |
| Luxembourgers | 99.9 /100 | #25 | Exceptional 16.4% |
| Immigrants | Croatia | 99.9 /100 | #26 | Exceptional 16.4% |
| Immigrants | Pakistan | 99.9 /100 | #27 | Exceptional 16.4% |
| Poles | 99.9 /100 | #28 | Exceptional 16.4% |
| Filipinos | 99.9 /100 | #29 | Exceptional 16.4% |