Danish vs Alsatian Cognitive Disability
COMPARE
Danish
Alsatian
Cognitive Disability
Cognitive Disability Comparison
Danes
Alsatians
16.7%
COGNITIVE DISABILITY
98.8/ 100
METRIC RATING
91st/ 347
METRIC RANK
17.7%
COGNITIVE DISABILITY
4.5/ 100
METRIC RATING
223rd/ 347
METRIC RANK
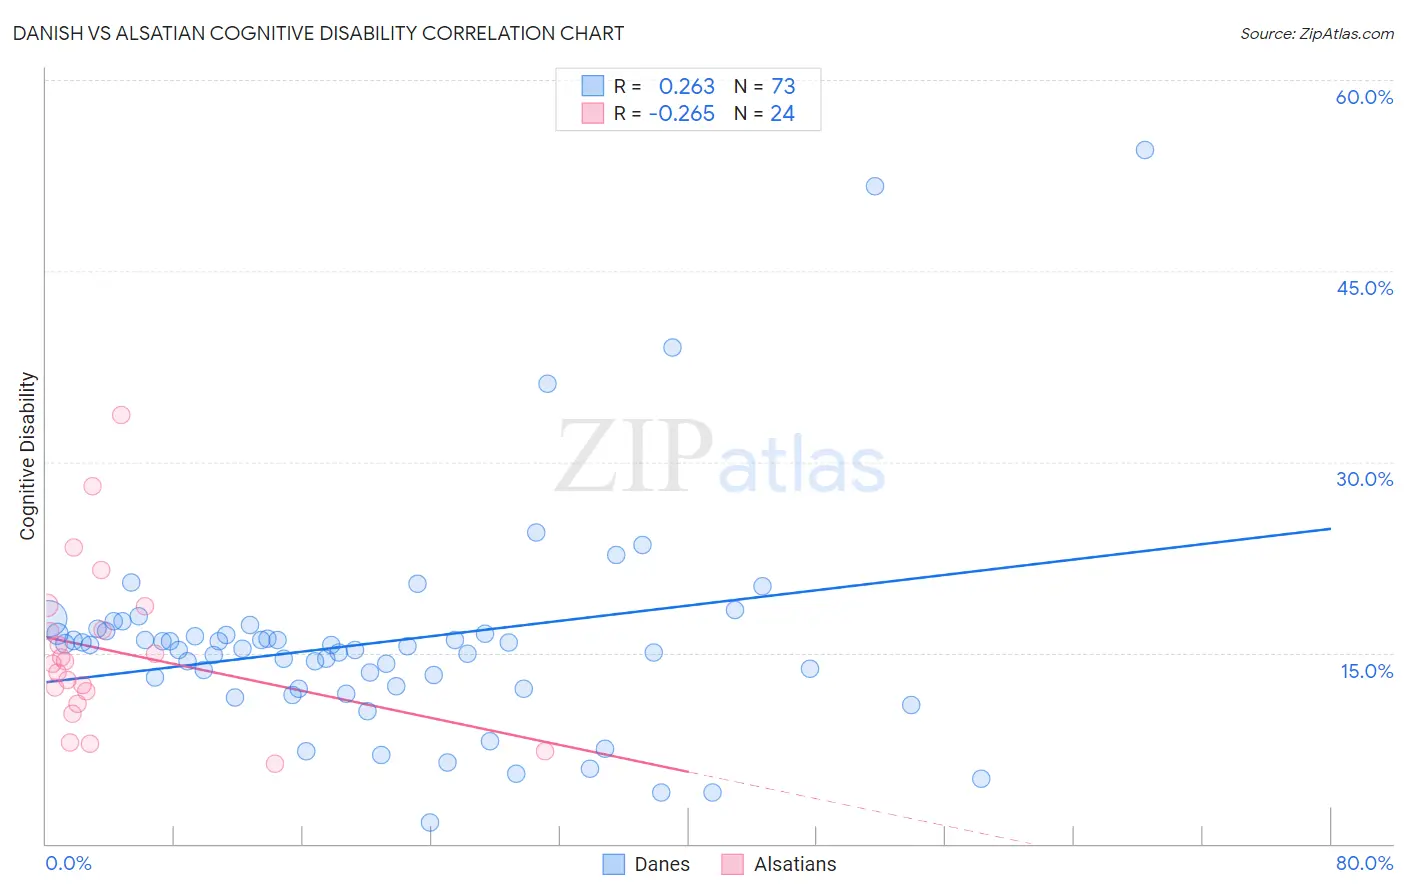
Danish vs Alsatian Cognitive Disability Correlation Chart
The statistical analysis conducted on geographies consisting of 474,128,115 people shows a weak positive correlation between the proportion of Danes and percentage of population with cognitive disability in the United States with a correlation coefficient (R) of 0.263 and weighted average of 16.7%. Similarly, the statistical analysis conducted on geographies consisting of 82,682,247 people shows a weak negative correlation between the proportion of Alsatians and percentage of population with cognitive disability in the United States with a correlation coefficient (R) of -0.265 and weighted average of 17.7%, a difference of 5.5%.
Cognitive Disability Correlation Summary
| Measurement | Danish | Alsatian |
| Minimum | 1.7% | 6.2% |
| Maximum | 54.5% | 33.7% |
| Range | 52.9% | 27.5% |
| Mean | 15.8% | 15.2% |
| Median | 15.5% | 14.3% |
| Interquartile 25% (IQ1) | 12.3% | 11.5% |
| Interquartile 75% (IQ3) | 16.6% | 17.7% |
| Interquartile Range (IQR) | 4.3% | 6.2% |
| Standard Deviation (Sample) | 8.6% | 6.5% |
| Standard Deviation (Population) | 8.6% | 6.4% |
Similar Demographics by Cognitive Disability
Demographics Similar to Danes by Cognitive Disability
In terms of cognitive disability, the demographic groups most similar to Danes are Immigrants from Egypt (16.7%, a difference of 0.010%), South American (16.7%, a difference of 0.010%), Immigrants from South America (16.7%, a difference of 0.010%), Immigrants from Southern Europe (16.7%, a difference of 0.020%), and Asian (16.7%, a difference of 0.060%).
| Demographics | Rating | Rank | Cognitive Disability |
| Belgians | 99.1 /100 | #84 | Exceptional 16.7% |
| Immigrants | Moldova | 99.1 /100 | #85 | Exceptional 16.7% |
| Immigrants | South Africa | 99.0 /100 | #86 | Exceptional 16.7% |
| Native Hawaiians | 99.0 /100 | #87 | Exceptional 16.7% |
| Immigrants | Philippines | 99.0 /100 | #88 | Exceptional 16.7% |
| Immigrants | Egypt | 98.8 /100 | #89 | Exceptional 16.7% |
| South Americans | 98.8 /100 | #90 | Exceptional 16.7% |
| Danes | 98.8 /100 | #91 | Exceptional 16.7% |
| Immigrants | South America | 98.8 /100 | #92 | Exceptional 16.7% |
| Immigrants | Southern Europe | 98.7 /100 | #93 | Exceptional 16.7% |
| Asians | 98.7 /100 | #94 | Exceptional 16.7% |
| English | 98.6 /100 | #95 | Exceptional 16.8% |
| Finns | 98.5 /100 | #96 | Exceptional 16.8% |
| Dutch | 98.5 /100 | #97 | Exceptional 16.8% |
| Immigrants | Lebanon | 98.4 /100 | #98 | Exceptional 16.8% |
Demographics Similar to Alsatians by Cognitive Disability
In terms of cognitive disability, the demographic groups most similar to Alsatians are Central American (17.7%, a difference of 0.010%), Fijian (17.7%, a difference of 0.19%), Vietnamese (17.7%, a difference of 0.20%), Moroccan (17.6%, a difference of 0.21%), and Zimbabwean (17.6%, a difference of 0.22%).
| Demographics | Rating | Rank | Cognitive Disability |
| Okinawans | 6.8 /100 | #216 | Tragic 17.6% |
| Salvadorans | 6.7 /100 | #217 | Tragic 17.6% |
| Icelanders | 6.4 /100 | #218 | Tragic 17.6% |
| Immigrants | Sierra Leone | 6.3 /100 | #219 | Tragic 17.6% |
| Zimbabweans | 6.1 /100 | #220 | Tragic 17.6% |
| Moroccans | 5.9 /100 | #221 | Tragic 17.6% |
| Central Americans | 4.5 /100 | #222 | Tragic 17.7% |
| Alsatians | 4.5 /100 | #223 | Tragic 17.7% |
| Fijians | 3.4 /100 | #224 | Tragic 17.7% |
| Vietnamese | 3.4 /100 | #225 | Tragic 17.7% |
| Marshallese | 2.7 /100 | #226 | Tragic 17.7% |
| Immigrants | St. Vincent and the Grenadines | 2.6 /100 | #227 | Tragic 17.7% |
| Immigrants | Central America | 2.3 /100 | #228 | Tragic 17.7% |
| Immigrants | Guatemala | 2.2 /100 | #229 | Tragic 17.7% |
| Mongolians | 2.2 /100 | #230 | Tragic 17.7% |