Cuban vs Immigrants from Nepal Hearing Disability
COMPARE
Cuban
Immigrants from Nepal
Hearing Disability
Hearing Disability Comparison
Cubans
Immigrants from Nepal
2.8%
HEARING DISABILITY
89.4/ 100
METRIC RATING
121st/ 347
METRIC RANK
2.7%
HEARING DISABILITY
98.3/ 100
METRIC RATING
65th/ 347
METRIC RANK
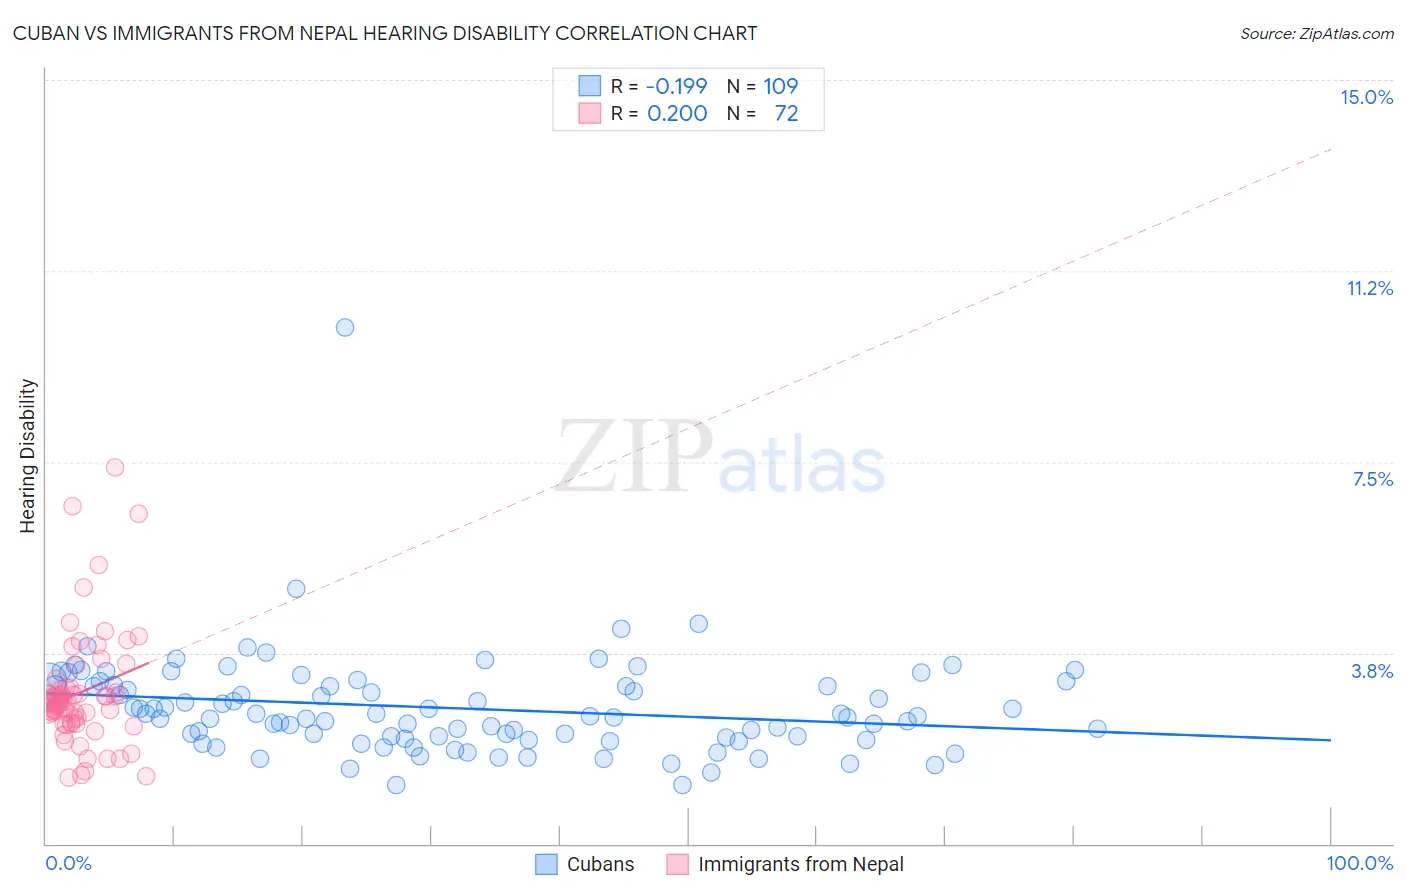
Cuban vs Immigrants from Nepal Hearing Disability Correlation Chart
The statistical analysis conducted on geographies consisting of 449,105,745 people shows a poor negative correlation between the proportion of Cubans and percentage of population with hearing disability in the United States with a correlation coefficient (R) of -0.199 and weighted average of 2.8%. Similarly, the statistical analysis conducted on geographies consisting of 186,754,465 people shows a weak positive correlation between the proportion of Immigrants from Nepal and percentage of population with hearing disability in the United States with a correlation coefficient (R) of 0.200 and weighted average of 2.7%, a difference of 5.0%.
Hearing Disability Correlation Summary
| Measurement | Cuban | Immigrants from Nepal |
| Minimum | 1.1% | 1.3% |
| Maximum | 10.1% | 7.4% |
| Range | 9.0% | 6.1% |
| Mean | 2.7% | 3.0% |
| Median | 2.5% | 2.8% |
| Interquartile 25% (IQ1) | 2.1% | 2.4% |
| Interquartile 75% (IQ3) | 3.1% | 3.0% |
| Interquartile Range (IQR) | 1.0% | 0.63% |
| Standard Deviation (Sample) | 1.0% | 1.1% |
| Standard Deviation (Population) | 1.0% | 1.1% |
Similar Demographics by Hearing Disability
Demographics Similar to Cubans by Hearing Disability
In terms of hearing disability, the demographic groups most similar to Cubans are Jordanian (2.8%, a difference of 0.030%), Liberian (2.8%, a difference of 0.090%), Kenyan (2.8%, a difference of 0.12%), Zimbabwean (2.8%, a difference of 0.14%), and Immigrants from Liberia (2.8%, a difference of 0.16%).
| Demographics | Rating | Rank | Hearing Disability |
| Cambodians | 91.1 /100 | #114 | Exceptional 2.8% |
| Immigrants | Latin America | 90.5 /100 | #115 | Exceptional 2.8% |
| Immigrants | Immigrants | 90.3 /100 | #116 | Exceptional 2.8% |
| Immigrants | Liberia | 90.0 /100 | #117 | Excellent 2.8% |
| Zimbabweans | 89.9 /100 | #118 | Excellent 2.8% |
| Kenyans | 89.8 /100 | #119 | Excellent 2.8% |
| Jordanians | 89.5 /100 | #120 | Excellent 2.8% |
| Cubans | 89.4 /100 | #121 | Excellent 2.8% |
| Liberians | 89.0 /100 | #122 | Excellent 2.8% |
| Immigrants | Zaire | 88.6 /100 | #123 | Excellent 2.9% |
| Bahamians | 88.6 /100 | #124 | Excellent 2.9% |
| Immigrants | Albania | 88.5 /100 | #125 | Excellent 2.9% |
| Immigrants | Sudan | 87.8 /100 | #126 | Excellent 2.9% |
| South American Indians | 86.9 /100 | #127 | Excellent 2.9% |
| Immigrants | Western Asia | 86.9 /100 | #128 | Excellent 2.9% |
Demographics Similar to Immigrants from Nepal by Hearing Disability
In terms of hearing disability, the demographic groups most similar to Immigrants from Nepal are Immigrants from Sri Lanka (2.7%, a difference of 0.080%), Immigrants from Belize (2.7%, a difference of 0.12%), Indian (Asian) (2.7%, a difference of 0.14%), Immigrants from Uzbekistan (2.7%, a difference of 0.19%), and Immigrants from Colombia (2.7%, a difference of 0.19%).
| Demographics | Rating | Rank | Hearing Disability |
| Immigrants | Peru | 98.6 /100 | #58 | Exceptional 2.7% |
| Immigrants | Eritrea | 98.5 /100 | #59 | Exceptional 2.7% |
| Immigrants | Egypt | 98.5 /100 | #60 | Exceptional 2.7% |
| Immigrants | Uzbekistan | 98.4 /100 | #61 | Exceptional 2.7% |
| Immigrants | Colombia | 98.4 /100 | #62 | Exceptional 2.7% |
| Indians (Asian) | 98.4 /100 | #63 | Exceptional 2.7% |
| Immigrants | Sri Lanka | 98.4 /100 | #64 | Exceptional 2.7% |
| Immigrants | Nepal | 98.3 /100 | #65 | Exceptional 2.7% |
| Immigrants | Belize | 98.2 /100 | #66 | Exceptional 2.7% |
| Egyptians | 98.1 /100 | #67 | Exceptional 2.7% |
| Immigrants | Africa | 98.0 /100 | #68 | Exceptional 2.7% |
| Nicaraguans | 97.9 /100 | #69 | Exceptional 2.7% |
| Peruvians | 97.7 /100 | #70 | Exceptional 2.7% |
| Central Americans | 97.7 /100 | #71 | Exceptional 2.7% |
| Afghans | 97.6 /100 | #72 | Exceptional 2.7% |