Creek vs Immigrants from Spain Disability Age 35 to 64
COMPARE
Creek
Immigrants from Spain
Disability Age 35 to 64
Disability Age 35 to 64 Comparison
Creek
Immigrants from Spain
16.9%
DISABILITY AGE 35 TO 64
0.0/ 100
METRIC RATING
343rd/ 347
METRIC RANK
10.0%
DISABILITY AGE 35 TO 64
99.7/ 100
METRIC RATING
61st/ 347
METRIC RANK
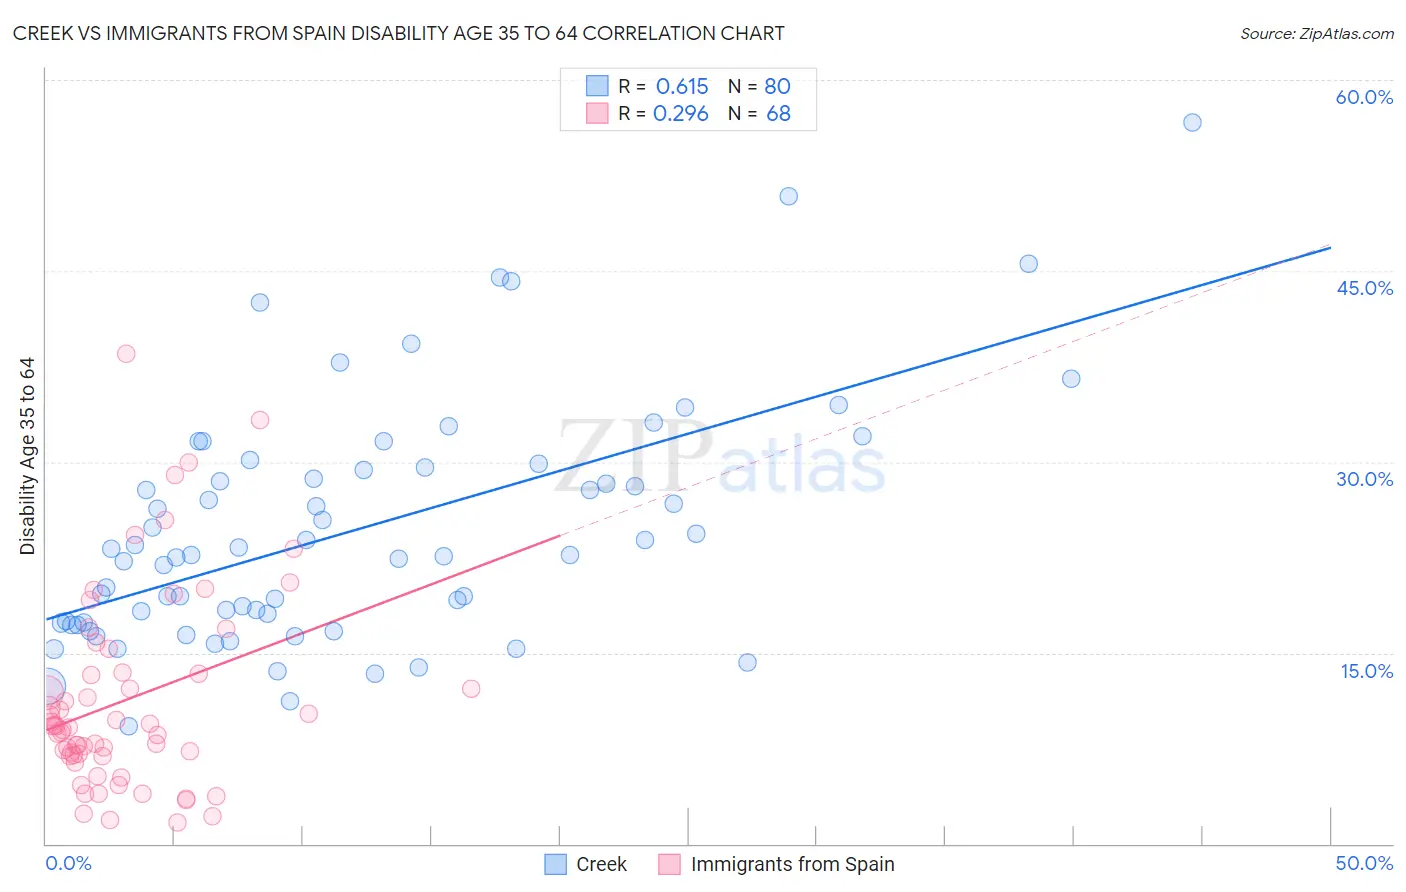
Creek vs Immigrants from Spain Disability Age 35 to 64 Correlation Chart
The statistical analysis conducted on geographies consisting of 178,427,541 people shows a significant positive correlation between the proportion of Creek and percentage of population with a disability between the ages 34 and 64 in the United States with a correlation coefficient (R) of 0.615 and weighted average of 16.9%. Similarly, the statistical analysis conducted on geographies consisting of 239,593,165 people shows a weak positive correlation between the proportion of Immigrants from Spain and percentage of population with a disability between the ages 34 and 64 in the United States with a correlation coefficient (R) of 0.296 and weighted average of 10.0%, a difference of 69.7%.
Disability Age 35 to 64 Correlation Summary
| Measurement | Creek | Immigrants from Spain |
| Minimum | 9.2% | 1.7% |
| Maximum | 56.7% | 38.5% |
| Range | 47.4% | 36.8% |
| Mean | 24.6% | 11.3% |
| Median | 22.7% | 9.2% |
| Interquartile 25% (IQ1) | 17.4% | 6.9% |
| Interquartile 75% (IQ3) | 29.5% | 13.4% |
| Interquartile Range (IQR) | 12.1% | 6.5% |
| Standard Deviation (Sample) | 9.4% | 7.7% |
| Standard Deviation (Population) | 9.3% | 7.7% |
Similar Demographics by Disability Age 35 to 64
Demographics Similar to Creek by Disability Age 35 to 64
In terms of disability age 35 to 64, the demographic groups most similar to Creek are Yup'ik (16.9%, a difference of 0.32%), Tohono O'odham (16.7%, a difference of 0.86%), Tsimshian (16.7%, a difference of 0.97%), Kiowa (17.4%, a difference of 2.8%), and Choctaw (16.4%, a difference of 2.9%).
| Demographics | Rating | Rank | Disability Age 35 to 64 |
| Yuman | 0.0 /100 | #333 | Tragic 15.8% |
| Colville | 0.0 /100 | #334 | Tragic 15.8% |
| Seminole | 0.0 /100 | #335 | Tragic 15.9% |
| Menominee | 0.0 /100 | #336 | Tragic 15.9% |
| Puerto Ricans | 0.0 /100 | #337 | Tragic 15.9% |
| Chickasaw | 0.0 /100 | #338 | Tragic 16.1% |
| Pima | 0.0 /100 | #339 | Tragic 16.1% |
| Choctaw | 0.0 /100 | #340 | Tragic 16.4% |
| Tsimshian | 0.0 /100 | #341 | Tragic 16.7% |
| Tohono O'odham | 0.0 /100 | #342 | Tragic 16.7% |
| Creek | 0.0 /100 | #343 | Tragic 16.9% |
| Yup'ik | 0.0 /100 | #344 | Tragic 16.9% |
| Kiowa | 0.0 /100 | #345 | Tragic 17.4% |
| Lumbee | 0.0 /100 | #346 | Tragic 17.6% |
| Houma | 0.0 /100 | #347 | Tragic 18.7% |
Demographics Similar to Immigrants from Spain by Disability Age 35 to 64
In terms of disability age 35 to 64, the demographic groups most similar to Immigrants from Spain are Eastern European (10.0%, a difference of 0.10%), Immigrants from South America (9.9%, a difference of 0.12%), Immigrants from Czechoslovakia (10.0%, a difference of 0.22%), Immigrants from Sweden (9.9%, a difference of 0.33%), and Immigrants from Romania (10.0%, a difference of 0.41%).
| Demographics | Rating | Rank | Disability Age 35 to 64 |
| Immigrants | Russia | 99.8 /100 | #54 | Exceptional 9.8% |
| Peruvians | 99.8 /100 | #55 | Exceptional 9.9% |
| South Americans | 99.8 /100 | #56 | Exceptional 9.9% |
| Colombians | 99.8 /100 | #57 | Exceptional 9.9% |
| Armenians | 99.8 /100 | #58 | Exceptional 9.9% |
| Immigrants | Sweden | 99.7 /100 | #59 | Exceptional 9.9% |
| Immigrants | South America | 99.7 /100 | #60 | Exceptional 9.9% |
| Immigrants | Spain | 99.7 /100 | #61 | Exceptional 10.0% |
| Eastern Europeans | 99.7 /100 | #62 | Exceptional 10.0% |
| Immigrants | Czechoslovakia | 99.7 /100 | #63 | Exceptional 10.0% |
| Immigrants | Romania | 99.7 /100 | #64 | Exceptional 10.0% |
| Immigrants | Poland | 99.6 /100 | #65 | Exceptional 10.0% |
| Cubans | 99.6 /100 | #66 | Exceptional 10.0% |
| Immigrants | Uzbekistan | 99.5 /100 | #67 | Exceptional 10.1% |
| Immigrants | Switzerland | 99.5 /100 | #68 | Exceptional 10.1% |