Colville vs Ethiopian Male Disability
COMPARE
Colville
Ethiopian
Male Disability
Male Disability Comparison
Colville
Ethiopians
16.5%
MALE DISABILITY
0.0/ 100
METRIC RATING
346th/ 347
METRIC RANK
10.2%
MALE DISABILITY
99.8/ 100
METRIC RATING
36th/ 347
METRIC RANK
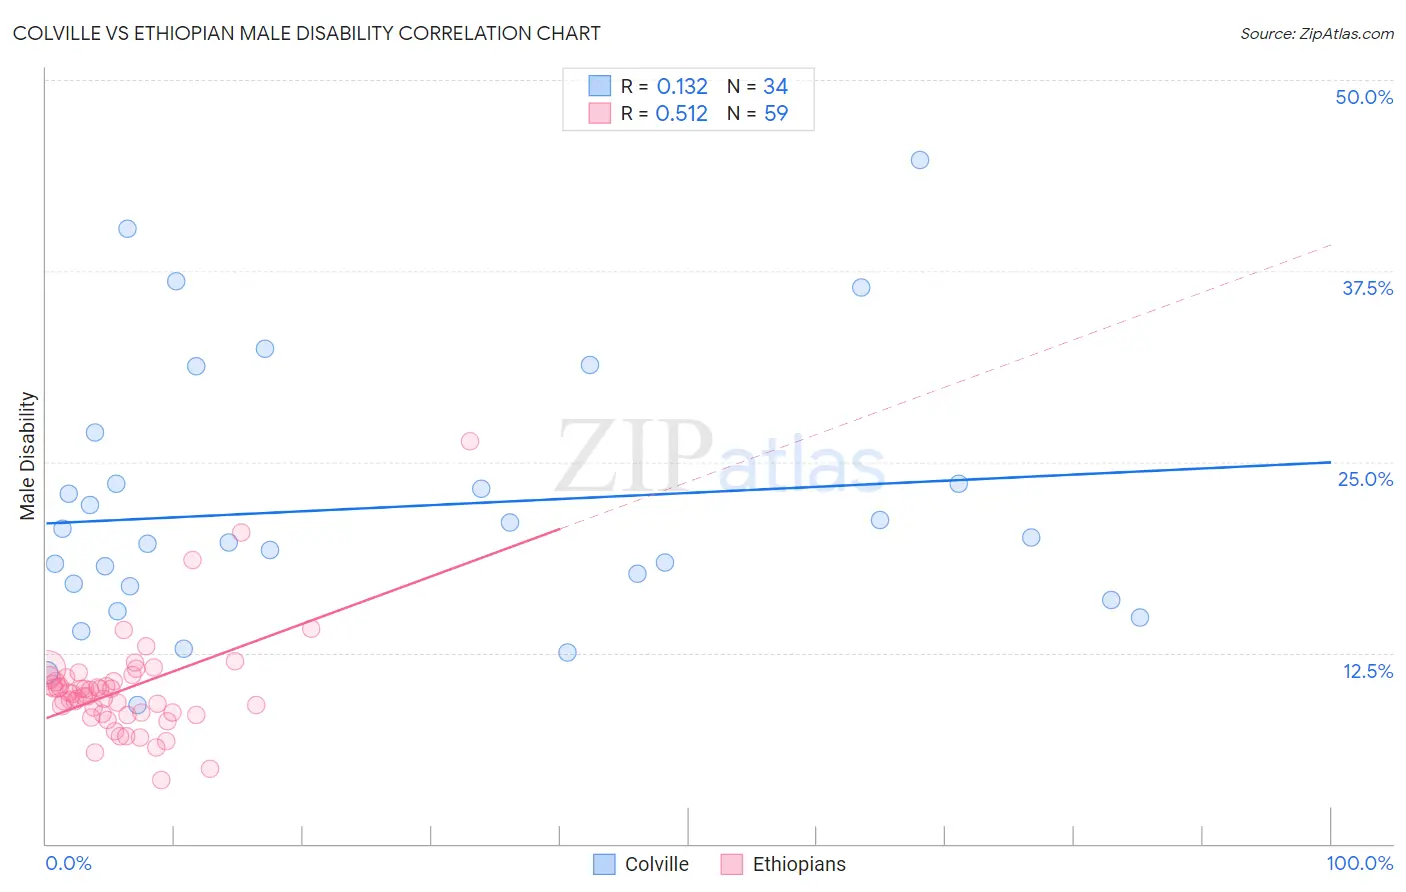
Colville vs Ethiopian Male Disability Correlation Chart
The statistical analysis conducted on geographies consisting of 34,678,900 people shows a poor positive correlation between the proportion of Colville and percentage of males with a disability in the United States with a correlation coefficient (R) of 0.132 and weighted average of 16.5%. Similarly, the statistical analysis conducted on geographies consisting of 223,232,754 people shows a substantial positive correlation between the proportion of Ethiopians and percentage of males with a disability in the United States with a correlation coefficient (R) of 0.512 and weighted average of 10.2%, a difference of 61.7%.
Male Disability Correlation Summary
| Measurement | Colville | Ethiopian |
| Minimum | 9.1% | 4.2% |
| Maximum | 44.7% | 26.3% |
| Range | 35.6% | 22.2% |
| Mean | 22.0% | 10.1% |
| Median | 19.9% | 9.8% |
| Interquartile 25% (IQ1) | 16.9% | 8.5% |
| Interquartile 75% (IQ3) | 23.6% | 10.8% |
| Interquartile Range (IQR) | 6.7% | 2.3% |
| Standard Deviation (Sample) | 8.5% | 3.4% |
| Standard Deviation (Population) | 8.4% | 3.4% |
Similar Demographics by Male Disability
Demographics Similar to Colville by Male Disability
In terms of male disability, the demographic groups most similar to Colville are Houma (17.4%, a difference of 5.7%), Tsimshian (15.6%, a difference of 5.8%), Puerto Rican (15.6%, a difference of 6.1%), Creek (15.5%, a difference of 6.2%), and Kiowa (15.4%, a difference of 7.0%).
| Demographics | Rating | Rank | Male Disability |
| Yuman | 0.0 /100 | #333 | Tragic 14.7% |
| Cherokee | 0.0 /100 | #334 | Tragic 14.8% |
| Dutch West Indians | 0.0 /100 | #335 | Tragic 14.8% |
| Alaskan Athabascans | 0.0 /100 | #336 | Tragic 14.9% |
| Menominee | 0.0 /100 | #337 | Tragic 15.0% |
| Pueblo | 0.0 /100 | #338 | Tragic 15.0% |
| Chickasaw | 0.0 /100 | #339 | Tragic 15.1% |
| Lumbee | 0.0 /100 | #340 | Tragic 15.2% |
| Choctaw | 0.0 /100 | #341 | Tragic 15.4% |
| Kiowa | 0.0 /100 | #342 | Tragic 15.4% |
| Creek | 0.0 /100 | #343 | Tragic 15.5% |
| Puerto Ricans | 0.0 /100 | #344 | Tragic 15.6% |
| Tsimshian | 0.0 /100 | #345 | Tragic 15.6% |
| Colville | 0.0 /100 | #346 | Tragic 16.5% |
| Houma | 0.0 /100 | #347 | Tragic 17.4% |
Demographics Similar to Ethiopians by Male Disability
In terms of male disability, the demographic groups most similar to Ethiopians are Immigrants from Argentina (10.2%, a difference of 0.050%), Immigrants from Indonesia (10.2%, a difference of 0.070%), Immigrants from Turkey (10.2%, a difference of 0.16%), Immigrants from Ethiopia (10.2%, a difference of 0.22%), and Immigrants from Kuwait (10.2%, a difference of 0.24%).
| Demographics | Rating | Rank | Male Disability |
| Venezuelans | 99.9 /100 | #29 | Exceptional 10.1% |
| Immigrants | Egypt | 99.9 /100 | #30 | Exceptional 10.1% |
| Soviet Union | 99.9 /100 | #31 | Exceptional 10.1% |
| Argentineans | 99.9 /100 | #32 | Exceptional 10.1% |
| Immigrants | Ethiopia | 99.9 /100 | #33 | Exceptional 10.2% |
| Immigrants | Turkey | 99.9 /100 | #34 | Exceptional 10.2% |
| Immigrants | Argentina | 99.9 /100 | #35 | Exceptional 10.2% |
| Ethiopians | 99.8 /100 | #36 | Exceptional 10.2% |
| Immigrants | Indonesia | 99.8 /100 | #37 | Exceptional 10.2% |
| Immigrants | Kuwait | 99.8 /100 | #38 | Exceptional 10.2% |
| Afghans | 99.8 /100 | #39 | Exceptional 10.2% |
| Immigrants | Nepal | 99.8 /100 | #40 | Exceptional 10.3% |
| Taiwanese | 99.8 /100 | #41 | Exceptional 10.3% |
| Mongolians | 99.7 /100 | #42 | Exceptional 10.3% |
| Immigrants | Bangladesh | 99.7 /100 | #43 | Exceptional 10.3% |