Colombian vs Aleut Hearing Disability
COMPARE
Colombian
Aleut
Hearing Disability
Hearing Disability Comparison
Colombians
Aleuts
2.7%
HEARING DISABILITY
97.4/ 100
METRIC RATING
79th/ 347
METRIC RANK
4.3%
HEARING DISABILITY
0.0/ 100
METRIC RATING
334th/ 347
METRIC RANK
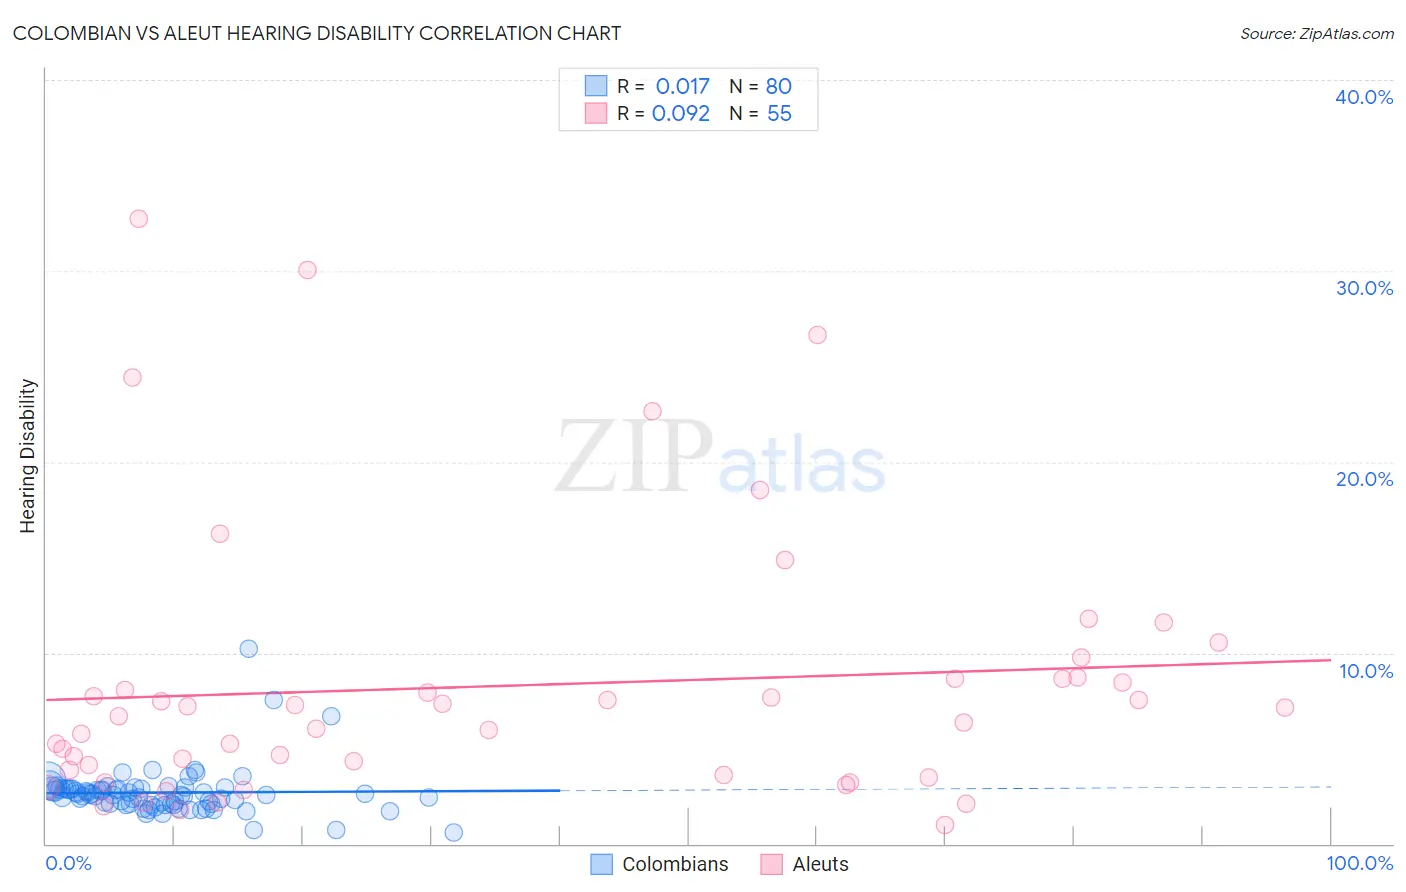
Colombian vs Aleut Hearing Disability Correlation Chart
The statistical analysis conducted on geographies consisting of 419,423,725 people shows no correlation between the proportion of Colombians and percentage of population with hearing disability in the United States with a correlation coefficient (R) of 0.017 and weighted average of 2.7%. Similarly, the statistical analysis conducted on geographies consisting of 61,781,709 people shows a slight positive correlation between the proportion of Aleuts and percentage of population with hearing disability in the United States with a correlation coefficient (R) of 0.092 and weighted average of 4.3%, a difference of 56.3%.
Hearing Disability Correlation Summary
| Measurement | Colombian | Aleut |
| Minimum | 0.57% | 0.97% |
| Maximum | 10.2% | 32.7% |
| Range | 9.7% | 31.7% |
| Mean | 2.7% | 8.3% |
| Median | 2.6% | 6.7% |
| Interquartile 25% (IQ1) | 2.1% | 3.6% |
| Interquartile 75% (IQ3) | 2.9% | 8.6% |
| Interquartile Range (IQR) | 0.79% | 5.0% |
| Standard Deviation (Sample) | 1.3% | 7.1% |
| Standard Deviation (Population) | 1.3% | 7.1% |
Similar Demographics by Hearing Disability
Demographics Similar to Colombians by Hearing Disability
In terms of hearing disability, the demographic groups most similar to Colombians are Mongolian (2.7%, a difference of 0.020%), Immigrants from Malaysia (2.7%, a difference of 0.060%), Asian (2.7%, a difference of 0.080%), Immigrants from Saudi Arabia (2.7%, a difference of 0.090%), and Immigrants from Korea (2.7%, a difference of 0.11%).
| Demographics | Rating | Rank | Hearing Disability |
| Afghans | 97.6 /100 | #72 | Exceptional 2.7% |
| Argentineans | 97.5 /100 | #73 | Exceptional 2.7% |
| Immigrants | Korea | 97.5 /100 | #74 | Exceptional 2.7% |
| Immigrants | Saudi Arabia | 97.5 /100 | #75 | Exceptional 2.7% |
| Asians | 97.5 /100 | #76 | Exceptional 2.7% |
| Immigrants | Malaysia | 97.5 /100 | #77 | Exceptional 2.7% |
| Mongolians | 97.4 /100 | #78 | Exceptional 2.7% |
| Colombians | 97.4 /100 | #79 | Exceptional 2.7% |
| Immigrants | Asia | 97.2 /100 | #80 | Exceptional 2.7% |
| Immigrants | Uruguay | 97.2 /100 | #81 | Exceptional 2.7% |
| Immigrants | Armenia | 97.2 /100 | #82 | Exceptional 2.7% |
| Immigrants | Cuba | 97.2 /100 | #83 | Exceptional 2.7% |
| Immigrants | Argentina | 97.0 /100 | #84 | Exceptional 2.8% |
| Immigrants | Northern Africa | 96.9 /100 | #85 | Exceptional 2.8% |
| Immigrants | Iran | 96.8 /100 | #86 | Exceptional 2.8% |
Demographics Similar to Aleuts by Hearing Disability
In terms of hearing disability, the demographic groups most similar to Aleuts are Dutch West Indian (4.3%, a difference of 0.54%), Houma (4.2%, a difference of 1.1%), Kiowa (4.3%, a difference of 1.3%), Cherokee (4.2%, a difference of 1.8%), and Native/Alaskan (4.2%, a difference of 2.0%).
| Demographics | Rating | Rank | Hearing Disability |
| Arapaho | 0.0 /100 | #327 | Tragic 4.1% |
| Tohono O'odham | 0.0 /100 | #328 | Tragic 4.2% |
| Crow | 0.0 /100 | #329 | Tragic 4.2% |
| Natives/Alaskans | 0.0 /100 | #330 | Tragic 4.2% |
| Cherokee | 0.0 /100 | #331 | Tragic 4.2% |
| Houma | 0.0 /100 | #332 | Tragic 4.2% |
| Dutch West Indians | 0.0 /100 | #333 | Tragic 4.3% |
| Aleuts | 0.0 /100 | #334 | Tragic 4.3% |
| Kiowa | 0.0 /100 | #335 | Tragic 4.3% |
| Creek | 0.0 /100 | #336 | Tragic 4.4% |
| Chickasaw | 0.0 /100 | #337 | Tragic 4.5% |
| Alaska Natives | 0.0 /100 | #338 | Tragic 4.5% |
| Choctaw | 0.0 /100 | #339 | Tragic 4.5% |
| Pueblo | 0.0 /100 | #340 | Tragic 4.6% |
| Navajo | 0.0 /100 | #341 | Tragic 4.6% |