Choctaw vs Somali Disability Age 65 to 74
COMPARE
Choctaw
Somali
Disability Age 65 to 74
Disability Age 65 to 74 Comparison
Choctaw
Somalis
30.2%
DISABILITY AGE 65 TO 74
0.0/ 100
METRIC RATING
329th/ 347
METRIC RANK
25.1%
DISABILITY AGE 65 TO 74
0.6/ 100
METRIC RATING
254th/ 347
METRIC RANK
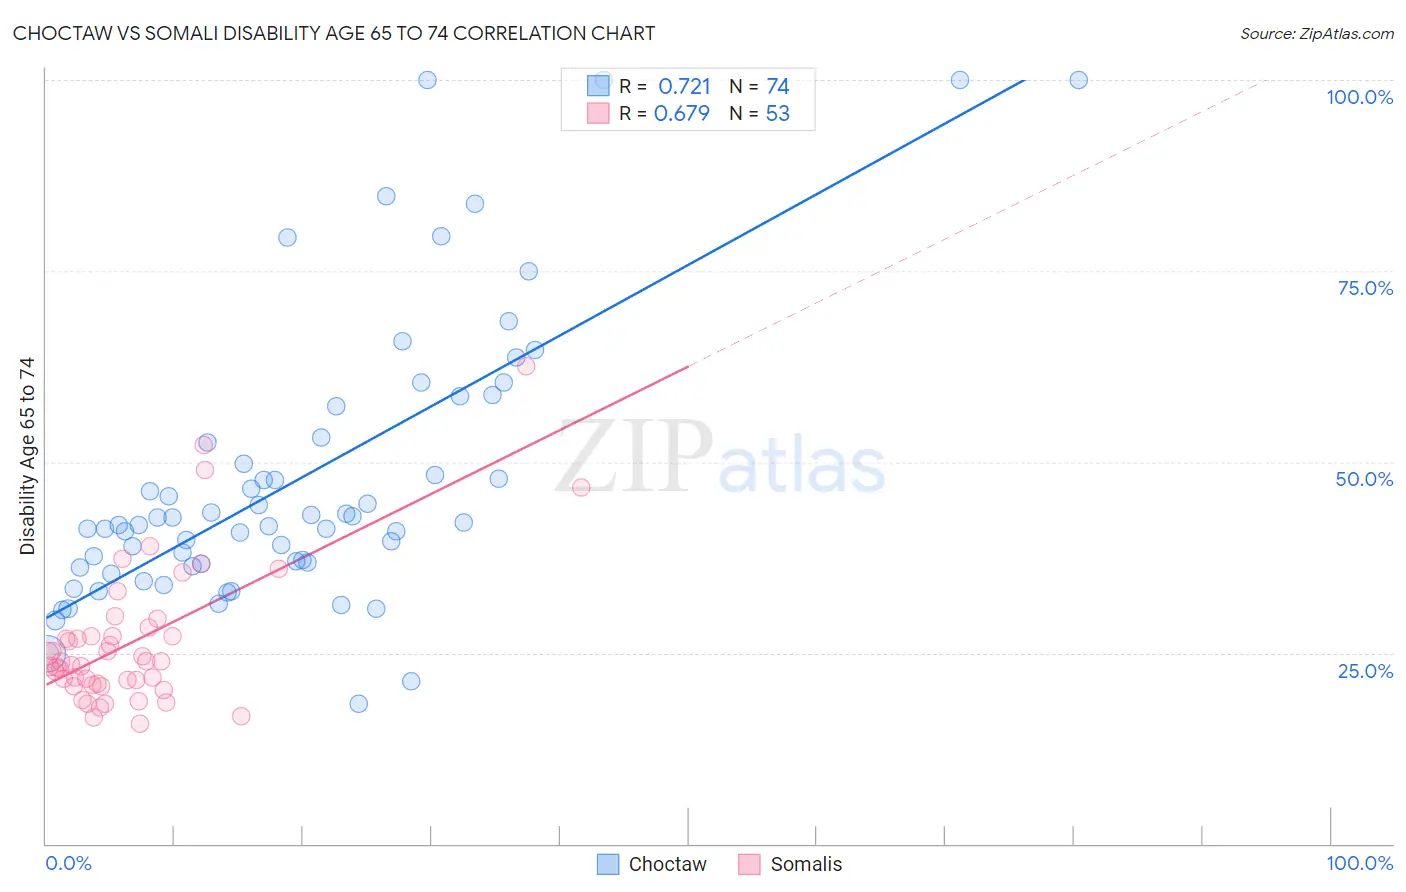
Choctaw vs Somali Disability Age 65 to 74 Correlation Chart
The statistical analysis conducted on geographies consisting of 269,363,120 people shows a strong positive correlation between the proportion of Choctaw and percentage of population with a disability between the ages 65 and 75 in the United States with a correlation coefficient (R) of 0.721 and weighted average of 30.2%. Similarly, the statistical analysis conducted on geographies consisting of 99,200,116 people shows a significant positive correlation between the proportion of Somalis and percentage of population with a disability between the ages 65 and 75 in the United States with a correlation coefficient (R) of 0.679 and weighted average of 25.1%, a difference of 20.3%.
Disability Age 65 to 74 Correlation Summary
| Measurement | Choctaw | Somali |
| Minimum | 18.3% | 15.7% |
| Maximum | 100.0% | 62.5% |
| Range | 81.7% | 46.8% |
| Mean | 47.9% | 26.5% |
| Median | 41.9% | 23.8% |
| Interquartile 25% (IQ1) | 36.7% | 20.9% |
| Interquartile 75% (IQ3) | 53.2% | 27.8% |
| Interquartile Range (IQR) | 16.5% | 6.9% |
| Standard Deviation (Sample) | 18.6% | 9.4% |
| Standard Deviation (Population) | 18.5% | 9.3% |
Similar Demographics by Disability Age 65 to 74
Demographics Similar to Choctaw by Disability Age 65 to 74
In terms of disability age 65 to 74, the demographic groups most similar to Choctaw are Creek (30.2%, a difference of 0.030%), Chickasaw (30.2%, a difference of 0.040%), Native/Alaskan (30.4%, a difference of 0.66%), Hopi (30.0%, a difference of 0.80%), and Colville (30.5%, a difference of 1.2%).
| Demographics | Rating | Rank | Disability Age 65 to 74 |
| Aleuts | 0.0 /100 | #322 | Tragic 28.4% |
| Puerto Ricans | 0.0 /100 | #323 | Tragic 29.1% |
| Seminole | 0.0 /100 | #324 | Tragic 29.4% |
| Dutch West Indians | 0.0 /100 | #325 | Tragic 29.6% |
| Yakama | 0.0 /100 | #326 | Tragic 29.6% |
| Apache | 0.0 /100 | #327 | Tragic 29.7% |
| Hopi | 0.0 /100 | #328 | Tragic 30.0% |
| Choctaw | 0.0 /100 | #329 | Tragic 30.2% |
| Creek | 0.0 /100 | #330 | Tragic 30.2% |
| Chickasaw | 0.0 /100 | #331 | Tragic 30.2% |
| Natives/Alaskans | 0.0 /100 | #332 | Tragic 30.4% |
| Colville | 0.0 /100 | #333 | Tragic 30.5% |
| Alaska Natives | 0.0 /100 | #334 | Tragic 30.6% |
| Cheyenne | 0.0 /100 | #335 | Tragic 31.1% |
| Yuman | 0.0 /100 | #336 | Tragic 31.5% |
Demographics Similar to Somalis by Disability Age 65 to 74
In terms of disability age 65 to 74, the demographic groups most similar to Somalis are Subsaharan African (25.1%, a difference of 0.080%), Immigrants from El Salvador (25.1%, a difference of 0.11%), Central American (25.1%, a difference of 0.16%), Nonimmigrants (25.0%, a difference of 0.30%), and Salvadoran (25.0%, a difference of 0.50%).
| Demographics | Rating | Rank | Disability Age 65 to 74 |
| Indonesians | 1.1 /100 | #247 | Tragic 24.9% |
| Senegalese | 0.9 /100 | #248 | Tragic 24.9% |
| Immigrants | Fiji | 0.8 /100 | #249 | Tragic 25.0% |
| Salvadorans | 0.8 /100 | #250 | Tragic 25.0% |
| Immigrants | Nonimmigrants | 0.7 /100 | #251 | Tragic 25.0% |
| Immigrants | El Salvador | 0.6 /100 | #252 | Tragic 25.1% |
| Sub-Saharan Africans | 0.6 /100 | #253 | Tragic 25.1% |
| Somalis | 0.6 /100 | #254 | Tragic 25.1% |
| Central Americans | 0.5 /100 | #255 | Tragic 25.1% |
| Immigrants | Somalia | 0.4 /100 | #256 | Tragic 25.2% |
| Guamanians/Chamorros | 0.3 /100 | #257 | Tragic 25.3% |
| Marshallese | 0.3 /100 | #258 | Tragic 25.3% |
| Immigrants | Cambodia | 0.3 /100 | #259 | Tragic 25.3% |
| Malaysians | 0.2 /100 | #260 | Tragic 25.4% |
| Cape Verdeans | 0.2 /100 | #261 | Tragic 25.4% |