Chinese vs Immigrants from Netherlands Disability Age 35 to 64
COMPARE
Chinese
Immigrants from Netherlands
Disability Age 35 to 64
Disability Age 35 to 64 Comparison
Chinese
Immigrants from Netherlands
10.3%
DISABILITY AGE 35 TO 64
98.7/ 100
METRIC RATING
95th/ 347
METRIC RANK
10.5%
DISABILITY AGE 35 TO 64
96.3/ 100
METRIC RATING
115th/ 347
METRIC RANK
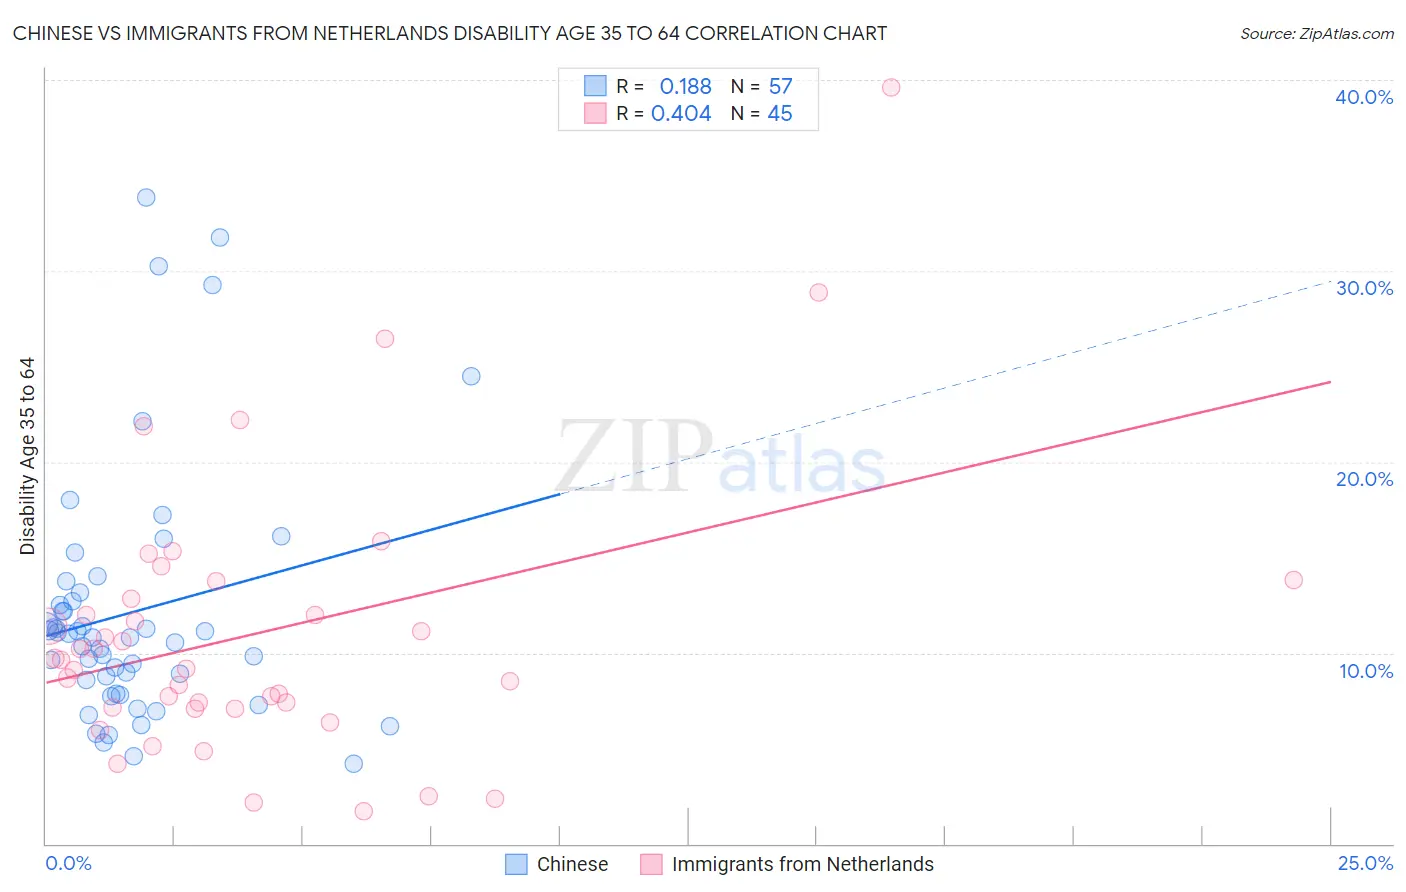
Chinese vs Immigrants from Netherlands Disability Age 35 to 64 Correlation Chart
The statistical analysis conducted on geographies consisting of 64,801,742 people shows a poor positive correlation between the proportion of Chinese and percentage of population with a disability between the ages 34 and 64 in the United States with a correlation coefficient (R) of 0.188 and weighted average of 10.3%. Similarly, the statistical analysis conducted on geographies consisting of 237,797,578 people shows a moderate positive correlation between the proportion of Immigrants from Netherlands and percentage of population with a disability between the ages 34 and 64 in the United States with a correlation coefficient (R) of 0.404 and weighted average of 10.5%, a difference of 2.3%.
Disability Age 35 to 64 Correlation Summary
| Measurement | Chinese | Immigrants from Netherlands |
| Minimum | 4.2% | 1.7% |
| Maximum | 33.9% | 39.6% |
| Range | 29.7% | 37.9% |
| Mean | 12.1% | 11.1% |
| Median | 10.8% | 9.6% |
| Interquartile 25% (IQ1) | 8.2% | 7.1% |
| Interquartile 75% (IQ3) | 12.9% | 13.3% |
| Interquartile Range (IQR) | 4.7% | 6.2% |
| Standard Deviation (Sample) | 6.6% | 7.3% |
| Standard Deviation (Population) | 6.5% | 7.2% |
Demographics Similar to Chinese and Immigrants from Netherlands by Disability Age 35 to 64
In terms of disability age 35 to 64, the demographic groups most similar to Chinese are Immigrants from South Africa (10.3%, a difference of 0.24%), Immigrants from Denmark (10.3%, a difference of 0.42%), Immigrants from Uruguay (10.3%, a difference of 0.49%), Palestinian (10.4%, a difference of 0.62%), and Immigrants from Jordan (10.4%, a difference of 0.84%). Similarly, the demographic groups most similar to Immigrants from Netherlands are Immigrants from Morocco (10.5%, a difference of 0.17%), Tongan (10.5%, a difference of 0.21%), Assyrian/Chaldean/Syriac (10.5%, a difference of 0.34%), Brazilian (10.5%, a difference of 0.37%), and Korean (10.5%, a difference of 0.57%).
| Demographics | Rating | Rank | Disability Age 35 to 64 |
| Chinese | 98.7 /100 | #95 | Exceptional 10.3% |
| Immigrants | South Africa | 98.5 /100 | #96 | Exceptional 10.3% |
| Immigrants | Denmark | 98.4 /100 | #97 | Exceptional 10.3% |
| Immigrants | Uruguay | 98.3 /100 | #98 | Exceptional 10.3% |
| Palestinians | 98.2 /100 | #99 | Exceptional 10.4% |
| Immigrants | Jordan | 98.1 /100 | #100 | Exceptional 10.4% |
| Immigrants | Philippines | 98.0 /100 | #101 | Exceptional 10.4% |
| Immigrants | Western Asia | 98.0 /100 | #102 | Exceptional 10.4% |
| Immigrants | Ukraine | 97.9 /100 | #103 | Exceptional 10.4% |
| Immigrants | Austria | 97.8 /100 | #104 | Exceptional 10.4% |
| Macedonians | 97.8 /100 | #105 | Exceptional 10.4% |
| Immigrants | Hungary | 97.6 /100 | #106 | Exceptional 10.4% |
| Zimbabweans | 97.4 /100 | #107 | Exceptional 10.4% |
| Ethiopians | 97.4 /100 | #108 | Exceptional 10.5% |
| Immigrants | Ethiopia | 97.2 /100 | #109 | Exceptional 10.5% |
| Koreans | 97.1 /100 | #110 | Exceptional 10.5% |
| Brazilians | 96.9 /100 | #111 | Exceptional 10.5% |
| Assyrians/Chaldeans/Syriacs | 96.8 /100 | #112 | Exceptional 10.5% |
| Tongans | 96.6 /100 | #113 | Exceptional 10.5% |
| Immigrants | Morocco | 96.6 /100 | #114 | Exceptional 10.5% |
| Immigrants | Netherlands | 96.3 /100 | #115 | Exceptional 10.5% |