Chilean vs Estonian Disability Age 18 to 34
COMPARE
Chilean
Estonian
Disability Age 18 to 34
Disability Age 18 to 34 Comparison
Chileans
Estonians
6.3%
DISABILITY AGE 18 TO 34
93.5/ 100
METRIC RATING
119th/ 347
METRIC RANK
6.8%
DISABILITY AGE 18 TO 34
20.6/ 100
METRIC RATING
197th/ 347
METRIC RANK
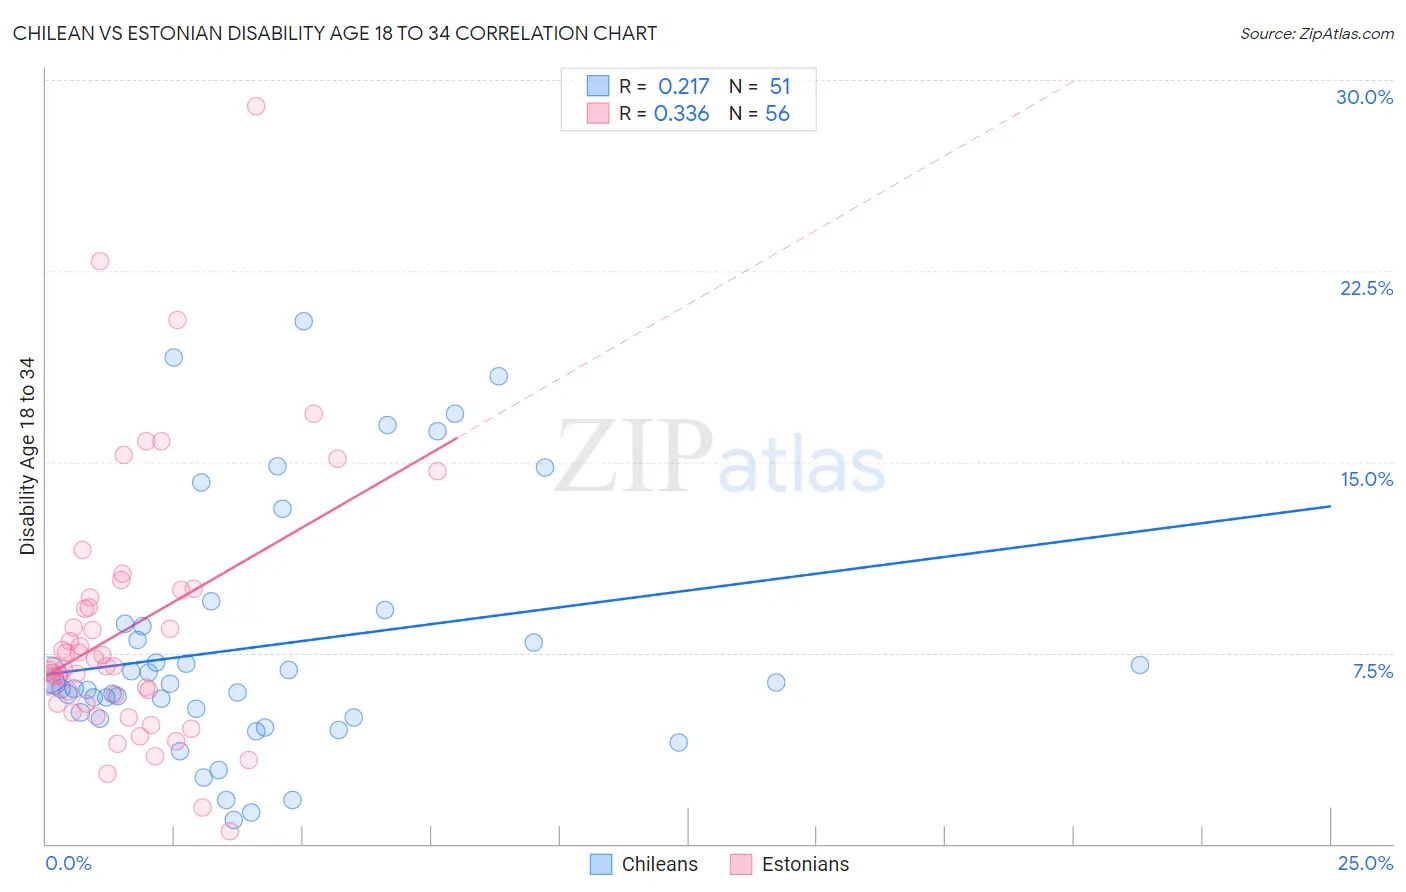
Chilean vs Estonian Disability Age 18 to 34 Correlation Chart
The statistical analysis conducted on geographies consisting of 256,471,605 people shows a weak positive correlation between the proportion of Chileans and percentage of population with a disability between the ages 18 and 35 in the United States with a correlation coefficient (R) of 0.217 and weighted average of 6.3%. Similarly, the statistical analysis conducted on geographies consisting of 123,466,484 people shows a mild positive correlation between the proportion of Estonians and percentage of population with a disability between the ages 18 and 35 in the United States with a correlation coefficient (R) of 0.336 and weighted average of 6.8%, a difference of 7.3%.
Disability Age 18 to 34 Correlation Summary
| Measurement | Chilean | Estonian |
| Minimum | 0.92% | 0.51% |
| Maximum | 20.5% | 28.9% |
| Range | 19.6% | 28.4% |
| Mean | 7.7% | 8.5% |
| Median | 6.3% | 7.0% |
| Interquartile 25% (IQ1) | 5.0% | 5.5% |
| Interquartile 75% (IQ3) | 8.7% | 9.8% |
| Interquartile Range (IQR) | 3.7% | 4.3% |
| Standard Deviation (Sample) | 4.8% | 5.2% |
| Standard Deviation (Population) | 4.8% | 5.2% |
Similar Demographics by Disability Age 18 to 34
Demographics Similar to Chileans by Disability Age 18 to 34
In terms of disability age 18 to 34, the demographic groups most similar to Chileans are Immigrants from Ukraine (6.3%, a difference of 0.030%), Immigrants from Guatemala (6.3%, a difference of 0.030%), Immigrants from Nepal (6.3%, a difference of 0.050%), Immigrants from Czechoslovakia (6.3%, a difference of 0.050%), and Immigrants from Costa Rica (6.3%, a difference of 0.15%).
| Demographics | Rating | Rank | Disability Age 18 to 34 |
| Immigrants | Romania | 94.9 /100 | #112 | Exceptional 6.3% |
| Immigrants | Latin America | 94.9 /100 | #113 | Exceptional 6.3% |
| Immigrants | South Eastern Asia | 94.4 /100 | #114 | Exceptional 6.3% |
| Koreans | 94.1 /100 | #115 | Exceptional 6.3% |
| Immigrants | Costa Rica | 94.0 /100 | #116 | Exceptional 6.3% |
| Immigrants | Jordan | 94.0 /100 | #117 | Exceptional 6.3% |
| Immigrants | Nepal | 93.7 /100 | #118 | Exceptional 6.3% |
| Chileans | 93.5 /100 | #119 | Exceptional 6.3% |
| Immigrants | Ukraine | 93.4 /100 | #120 | Exceptional 6.3% |
| Immigrants | Guatemala | 93.4 /100 | #121 | Exceptional 6.3% |
| Immigrants | Czechoslovakia | 93.3 /100 | #122 | Exceptional 6.3% |
| Costa Ricans | 92.9 /100 | #123 | Exceptional 6.3% |
| Immigrants | Morocco | 92.9 /100 | #124 | Exceptional 6.3% |
| Macedonians | 92.6 /100 | #125 | Exceptional 6.3% |
| Immigrants | Switzerland | 92.5 /100 | #126 | Exceptional 6.3% |
Demographics Similar to Estonians by Disability Age 18 to 34
In terms of disability age 18 to 34, the demographic groups most similar to Estonians are Immigrants from Netherlands (6.7%, a difference of 0.040%), Australian (6.8%, a difference of 0.13%), Mexican American Indian (6.7%, a difference of 0.17%), Kenyan (6.8%, a difference of 0.25%), and Sierra Leonean (6.8%, a difference of 0.34%).
| Demographics | Rating | Rank | Disability Age 18 to 34 |
| Immigrants | Zimbabwe | 33.6 /100 | #190 | Fair 6.7% |
| Immigrants | Eastern Africa | 33.2 /100 | #191 | Fair 6.7% |
| Immigrants | Western Africa | 28.3 /100 | #192 | Fair 6.7% |
| Immigrants | Uganda | 25.1 /100 | #193 | Fair 6.7% |
| Immigrants | Sudan | 24.9 /100 | #194 | Fair 6.7% |
| Mexican American Indians | 22.3 /100 | #195 | Fair 6.7% |
| Immigrants | Netherlands | 21.0 /100 | #196 | Fair 6.7% |
| Estonians | 20.6 /100 | #197 | Fair 6.8% |
| Australians | 19.4 /100 | #198 | Poor 6.8% |
| Kenyans | 18.3 /100 | #199 | Poor 6.8% |
| Sierra Leoneans | 17.5 /100 | #200 | Poor 6.8% |
| Greeks | 16.1 /100 | #201 | Poor 6.8% |
| Panamanians | 15.8 /100 | #202 | Poor 6.8% |
| Hispanics or Latinos | 13.8 /100 | #203 | Poor 6.8% |
| Immigrants | Bosnia and Herzegovina | 13.6 /100 | #204 | Poor 6.8% |