Cheyenne vs Immigrants from Denmark Hearing Disability
COMPARE
Cheyenne
Immigrants from Denmark
Hearing Disability
Hearing Disability Comparison
Cheyenne
Immigrants from Denmark
4.0%
HEARING DISABILITY
0.0/ 100
METRIC RATING
318th/ 347
METRIC RANK
3.1%
HEARING DISABILITY
16.2/ 100
METRIC RATING
203rd/ 347
METRIC RANK
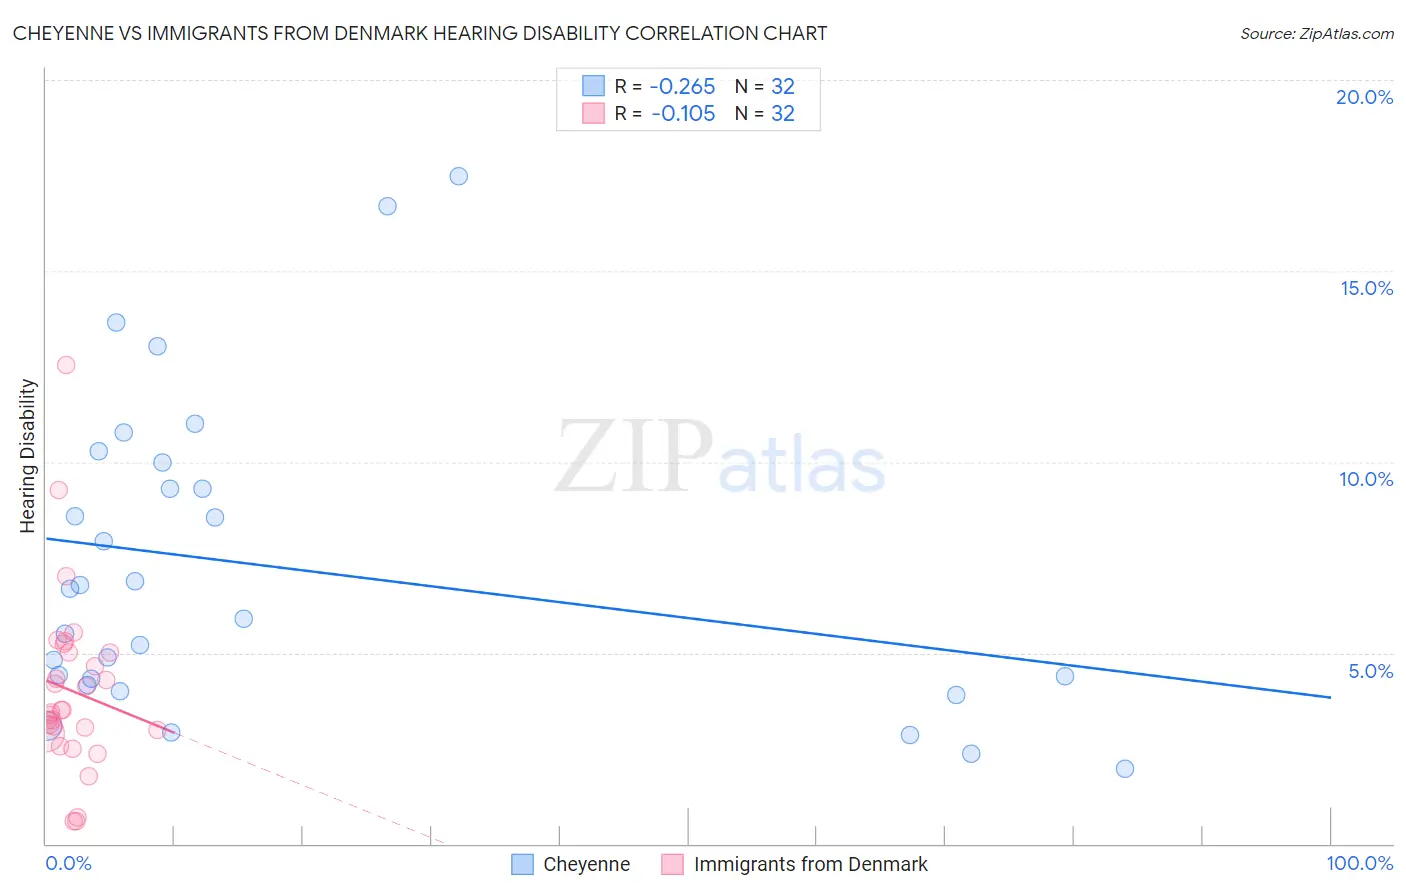
Cheyenne vs Immigrants from Denmark Hearing Disability Correlation Chart
The statistical analysis conducted on geographies consisting of 80,707,533 people shows a weak negative correlation between the proportion of Cheyenne and percentage of population with hearing disability in the United States with a correlation coefficient (R) of -0.265 and weighted average of 4.0%. Similarly, the statistical analysis conducted on geographies consisting of 136,425,612 people shows a poor negative correlation between the proportion of Immigrants from Denmark and percentage of population with hearing disability in the United States with a correlation coefficient (R) of -0.105 and weighted average of 3.1%, a difference of 27.6%.
Hearing Disability Correlation Summary
| Measurement | Cheyenne | Immigrants from Denmark |
| Minimum | 2.0% | 0.58% |
| Maximum | 17.5% | 12.5% |
| Range | 15.5% | 12.0% |
| Mean | 7.2% | 4.0% |
| Median | 6.3% | 3.5% |
| Interquartile 25% (IQ1) | 4.2% | 2.9% |
| Interquartile 75% (IQ3) | 9.6% | 5.0% |
| Interquartile Range (IQR) | 5.4% | 2.1% |
| Standard Deviation (Sample) | 4.0% | 2.4% |
| Standard Deviation (Population) | 4.0% | 2.3% |
Similar Demographics by Hearing Disability
Demographics Similar to Cheyenne by Hearing Disability
In terms of hearing disability, the demographic groups most similar to Cheyenne are Comanche (4.0%, a difference of 0.17%), Spanish American (4.0%, a difference of 0.31%), Puget Sound Salish (3.9%, a difference of 0.51%), Yakama (3.9%, a difference of 0.52%), and Chippewa (4.0%, a difference of 0.65%).
| Demographics | Rating | Rank | Hearing Disability |
| Americans | 0.0 /100 | #311 | Tragic 3.9% |
| Cajuns | 0.0 /100 | #312 | Tragic 3.9% |
| Hopi | 0.0 /100 | #313 | Tragic 3.9% |
| Yakama | 0.0 /100 | #314 | Tragic 3.9% |
| Puget Sound Salish | 0.0 /100 | #315 | Tragic 3.9% |
| Spanish Americans | 0.0 /100 | #316 | Tragic 4.0% |
| Comanche | 0.0 /100 | #317 | Tragic 4.0% |
| Cheyenne | 0.0 /100 | #318 | Tragic 4.0% |
| Chippewa | 0.0 /100 | #319 | Tragic 4.0% |
| Shoshone | 0.0 /100 | #320 | Tragic 4.0% |
| Paiute | 0.0 /100 | #321 | Tragic 4.1% |
| Seminole | 0.0 /100 | #322 | Tragic 4.1% |
| Apache | 0.0 /100 | #323 | Tragic 4.1% |
| Osage | 0.0 /100 | #324 | Tragic 4.1% |
| Lumbee | 0.0 /100 | #325 | Tragic 4.1% |
Demographics Similar to Immigrants from Denmark by Hearing Disability
In terms of hearing disability, the demographic groups most similar to Immigrants from Denmark are Immigrants from Thailand (3.1%, a difference of 0.040%), Immigrants from Czechoslovakia (3.1%, a difference of 0.050%), Alsatian (3.1%, a difference of 0.050%), Eastern European (3.1%, a difference of 0.12%), and Hispanic or Latino (3.1%, a difference of 0.18%).
| Demographics | Rating | Rank | Hearing Disability |
| Immigrants | Europe | 22.9 /100 | #196 | Fair 3.1% |
| Immigrants | Bosnia and Herzegovina | 20.6 /100 | #197 | Fair 3.1% |
| Immigrants | Croatia | 20.5 /100 | #198 | Fair 3.1% |
| Syrians | 19.2 /100 | #199 | Poor 3.1% |
| Immigrants | North Macedonia | 19.1 /100 | #200 | Poor 3.1% |
| Iraqis | 19.0 /100 | #201 | Poor 3.1% |
| Immigrants | Thailand | 16.4 /100 | #202 | Poor 3.1% |
| Immigrants | Denmark | 16.2 /100 | #203 | Poor 3.1% |
| Immigrants | Czechoslovakia | 15.9 /100 | #204 | Poor 3.1% |
| Alsatians | 15.9 /100 | #205 | Poor 3.1% |
| Eastern Europeans | 15.5 /100 | #206 | Poor 3.1% |
| Hispanics or Latinos | 15.1 /100 | #207 | Poor 3.1% |
| Immigrants | Latvia | 12.7 /100 | #208 | Poor 3.1% |
| Immigrants | Hungary | 12.5 /100 | #209 | Poor 3.1% |
| Cape Verdeans | 12.2 /100 | #210 | Poor 3.1% |